|
Download Data (XLS File) |
|
||||||||
|
||||||||
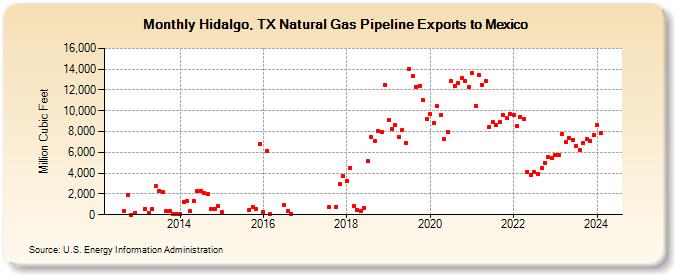
| Hidalgo, TX Natural Gas Pipeline Exports to Mexico (Million Cubic Feet) | ||||||||
| Year | Jan | Feb | Mar | Apr | May | Jun | Jul | Aug | Sep | Oct | Nov | Dec |
|---|---|---|---|---|---|---|---|---|---|---|---|---|
| 2012 | 392 | 1,937 | 10 | 168 | ||||||||
| 2013 | 529 | 130 | 536 | 2,754 | 2,315 | 2,140 | 310 | 354 | 69 | 90 | ||
| 2014 | 110 | 1,240 | 1,287 | 324 | 1,309 | 2,247 | 2,249 | 2,115 | 1,959 | 574 | 574 | 872 |
| 2015 | 260 | 481 | 699 | 567 | 6,810 | |||||||
| 2016 | 286 | 6,090 | 40 | 927 | 346 | 96 | ||||||
| 2017 | 752 | 739 | 2,938 | 3,692 | ||||||||
| 2018 | 3,220 | 4,532 | 830 | 474 | 376 | 686 | 5,190 | 7,431 | 7,075 | 8,027 | 7,994 | 12,460 |
| 2019 | 9,099 | 8,268 | 8,637 | 7,474 | 8,145 | 6,881 | 14,045 | 13,388 | 12,286 | 12,419 | 10,999 | 9,178 |
| 2020 | 9,689 | 8,832 | 10,495 | 9,594 | 7,297 | 7,927 | 12,846 | 12,382 | 12,668 | 13,110 | 12,870 | 12,283 |
| 2021 | 13,670 | 10,476 | 13,396 | 12,520 | 12,819 | 8,411 | 8,909 | 8,589 | 8,877 | 9,560 | 9,269 | 9,701 |
| 2022 | 9,616 | 8,556 | 9,427 | 9,164 | 4,132 | 3,833 | 4,105 | 3,952 | 4,540 | 4,999 | 5,546 | 5,416 |
| 2023 | 5,789 | 5,761 | 7,782 | 6,989 | 7,347 | 7,187 | 6,617 | 6,205 | 6,902 | 7,296 | 7,128 | 7,643 |
| 2024 | 8,606 | 7,857 | ||||||||||
| - = No Data Reported; -- = Not Applicable; NA = Not Available; W = Withheld to avoid disclosure of individual company data. |
| Release Date: 4/30/2024 |
| Next Release Date: 5/31/2024 |