|
Download Data (XLS File) |
|
||||||||
|
||||||||
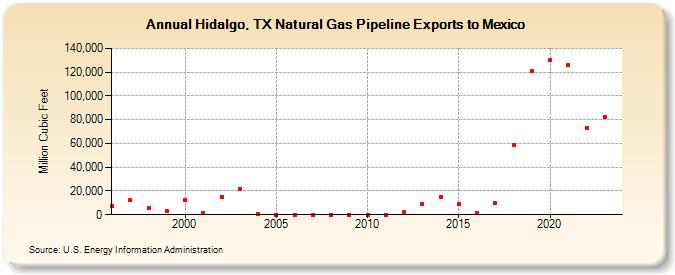
| Hidalgo, TX Natural Gas Pipeline Exports to Mexico (Million Cubic Feet) | ||||||||
| Decade | Year-0 | Year-1 | Year-2 | Year-3 | Year-4 | Year-5 | Year-6 | Year-7 | Year-8 | Year-9 |
|---|---|---|---|---|---|---|---|---|---|---|
| 1990's | 7,597 | 12,035 | 6,017 | 2,757 | ||||||
| 2000's | 12,639 | 1,398 | 15,318 | 21,497 | 795 | 0 | 0 | 0 | 0 | 10 |
| 2010's | 0 | 0 | 2,506 | 9,227 | 14,862 | 8,817 | 1,695 | 9,628 | 58,295 | 120,818 |
| 2020's | 129,992 | 126,196 | 73,286 | 82,647 |
| - = No Data Reported; -- = Not Applicable; NA = Not Available; W = Withheld to avoid disclosure of individual company data. |
| Release Date: 4/30/2024 |
| Next Release Date: 5/31/2024 |