|
Download Data (XLS File) |
|
||||||||
|
||||||||
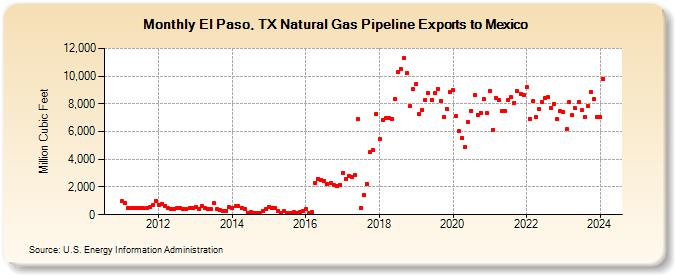
| El Paso, TX Natural Gas Pipeline Exports to Mexico (Million Cubic Feet) | ||||||||
| Year | Jan | Feb | Mar | Apr | May | Jun | Jul | Aug | Sep | Oct | Nov | Dec |
|---|---|---|---|---|---|---|---|---|---|---|---|---|
| 2011 | 958 | 860 | 509 | 487 | 503 | 482 | 449 | 452 | 456 | 531 | 670 | 1,024 |
| 2012 | 710 | 783 | 648 | 505 | 407 | 432 | 469 | 490 | 383 | 409 | 493 | 510 |
| 2013 | 571 | 446 | 632 | 481 | 440 | 409 | 819 | 448 | 321 | 245 | 287 | 557 |
| 2014 | 507 | 623 | 636 | 492 | 393 | 153 | 165 | 153 | 121 | 123 | 267 | 422 |
| 2015 | 587 | 514 | 496 | 301 | 159 | 255 | 129 | 154 | 165 | 146 | 180 | 288 |
| 2016 | 387 | 155 | 185 | 2,318 | 2,597 | 2,470 | 2,411 | 2,193 | 2,262 | 2,118 | 2,051 | 2,167 |
| 2017 | 3,043 | 2,590 | 2,762 | 2,736 | 2,860 | 6,890 | 510 | 1,421 | 2,199 | 4,501 | 4,661 | 7,302 |
| 2018 | 5,433 | 6,846 | 6,954 | 6,956 | 6,897 | 8,329 | 10,265 | 10,497 | 11,331 | 10,203 | 7,820 | 9,060 |
| 2019 | 9,459 | 7,298 | 7,564 | 8,249 | 8,749 | 8,284 | 8,760 | 9,097 | 8,231 | 7,046 | 7,628 | 8,848 |
| 2020 | 8,995 | 7,088 | 6,057 | 5,557 | 4,915 | 6,690 | 7,514 | 8,619 | 7,206 | 7,373 | 8,347 | 7,329 |
| 2021 | 8,933 | 6,148 | 8,428 | 8,289 | 7,511 | 7,455 | 8,311 | 8,457 | 8,067 | 8,901 | 8,745 | 8,645 |
| 2022 | 9,205 | 6,909 | 8,169 | 7,036 | 7,618 | 8,122 | 8,388 | 8,468 | 7,686 | 8,015 | 6,887 | 7,477 |
| 2023 | 7,443 | 6,157 | 8,116 | 7,185 | 7,678 | 8,131 | 7,569 | 7,043 | 7,848 | 8,838 | 8,339 | 7,073 |
| 2024 | 7,046 | 9,781 | ||||||||||
| - = No Data Reported; -- = Not Applicable; NA = Not Available; W = Withheld to avoid disclosure of individual company data. |
| Release Date: 4/30/2024 |
| Next Release Date: 5/31/2024 |