|
Download Data (XLS File) |
|
||||||||
|
||||||||
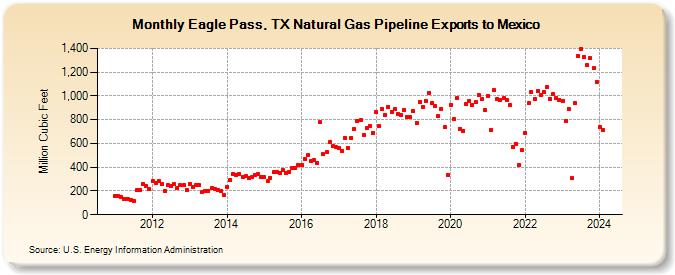
| Eagle Pass, TX Natural Gas Pipeline Exports to Mexico (Million Cubic Feet) | ||||||||
| Year | Jan | Feb | Mar | Apr | May | Jun | Jul | Aug | Sep | Oct | Nov | Dec |
|---|---|---|---|---|---|---|---|---|---|---|---|---|
| 2011 | 159 | 155 | 151 | 135 | 135 | 127 | 118 | 210 | 210 | 257 | 243 | 213 |
| 2012 | 281 | 269 | 283 | 258 | 201 | 247 | 244 | 256 | 228 | 247 | 246 | 212 |
| 2013 | 259 | 236 | 246 | 250 | 194 | 202 | 203 | 229 | 216 | 206 | 197 | 170 |
| 2014 | 234 | 294 | 342 | 331 | 343 | 319 | 323 | 306 | 315 | 331 | 342 | 320 |
| 2015 | 316 | 282 | 312 | 356 | 358 | 354 | 374 | 354 | 363 | 397 | 397 | 418 |
| 2016 | 418 | 469 | 499 | 452 | 457 | 438 | 777 | 507 | 524 | 614 | 575 | 574 |
| 2017 | 561 | 538 | 649 | 561 | 649 | 722 | 793 | 794 | 673 | 726 | 746 | 692 |
| 2018 | 866 | 745 | 894 | 840 | 907 | 865 | 890 | 851 | 836 | 885 | 823 | 822 |
| 2019 | 871 | 775 | 947 | 909 | 959 | 1,025 | 942 | 914 | 829 | 891 | 735 | 333 |
| 2020 | 924 | 803 | 981 | 724 | 708 | 931 | 959 | 926 | 945 | 1,009 | 970 | 883 |
| 2021 | 1,002 | 714 | 1,048 | 975 | 968 | 979 | 969 | 924 | 574 | 598 | 421 | 547 |
| 2022 | 691 | 938 | 1,034 | 975 | 1,040 | 1,004 | 1,035 | 1,071 | 976 | 1,017 | 983 | 968 |
| 2023 | 959 | 787 | 890 | 306 | 939 | 1,338 | 1,397 | 1,331 | 1,256 | 1,317 | 1,233 | 1,121 |
| 2024 | 735 | |||||||||||
| - = No Data Reported; -- = Not Applicable; NA = Not Available; W = Withheld to avoid disclosure of individual company data. |
| Release Date: 3/29/2024 |
| Next Release Date: 4/30/2024 |