|
Download Data (XLS File) |
|
||||||||
|
||||||||
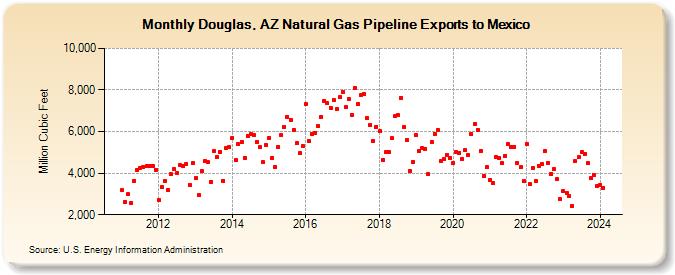
| Douglas, AZ Natural Gas Pipeline Exports to Mexico (Million Cubic Feet) | ||||||||
| Year | Jan | Feb | Mar | Apr | May | Jun | Jul | Aug | Sep | Oct | Nov | Dec |
|---|---|---|---|---|---|---|---|---|---|---|---|---|
| 2011 | 3,165 | 2,613 | 2,982 | 2,580 | 3,630 | 4,173 | 4,252 | 4,303 | 4,321 | 4,326 | 4,325 | 4,166 |
| 2012 | 2,707 | 3,334 | 3,628 | 3,181 | 3,942 | 4,185 | 4,017 | 4,371 | 4,331 | 4,443 | 3,452 | 4,478 |
| 2013 | 3,747 | 2,936 | 4,085 | 4,564 | 4,514 | 3,592 | 5,051 | 4,769 | 5,034 | 3,635 | 5,217 | 5,236 |
| 2014 | 5,700 | 4,608 | 5,394 | 5,494 | 4,749 | 5,806 | 5,859 | 5,825 | 5,517 | 5,242 | 4,517 | 5,361 |
| 2015 | 5,709 | 4,751 | 4,296 | 5,271 | 5,820 | 6,239 | 6,699 | 6,569 | 6,096 | 5,434 | 4,955 | 5,304 |
| 2016 | 7,306 | 5,525 | 5,877 | 5,954 | 6,274 | 6,689 | 7,463 | 7,361 | 7,147 | 7,511 | 7,075 | 7,645 |
| 2017 | 7,924 | 7,178 | 7,578 | 6,808 | 8,117 | 7,347 | 7,743 | 7,818 | 6,646 | 6,337 | 5,534 | 6,237 |
| 2018 | 6,023 | 4,640 | 5,013 | 5,027 | 5,689 | 6,736 | 6,791 | 7,631 | 6,202 | 5,588 | 4,101 | 4,526 |
| 2019 | 5,827 | 5,069 | 5,189 | 5,164 | 3,935 | 5,478 | 5,896 | 6,053 | 4,595 | 4,669 | 4,895 | 4,728 |
| 2020 | 4,471 | 5,039 | 4,986 | 4,682 | 5,101 | 4,883 | 5,887 | 6,378 | 6,097 | 5,065 | 3,865 | 4,280 |
| 2021 | 3,663 | 3,502 | 4,767 | 4,740 | 4,476 | 4,835 | 5,378 | 5,264 | 5,276 | 4,490 | 4,273 | 3,632 |
| 2022 | 5,411 | 3,454 | 4,250 | 3,603 | 4,338 | 4,461 | 5,058 | 4,509 | 3,956 | 4,186 | 3,701 | 2,737 |
| 2023 | 3,120 | 3,060 | 2,896 | 2,419 | 4,586 | 4,761 | 4,999 | 4,922 | 4,479 | 3,743 | 3,899 | 3,402 |
| 2024 | 3,439 | |||||||||||
| - = No Data Reported; -- = Not Applicable; NA = Not Available; W = Withheld to avoid disclosure of individual company data. |
| Release Date: 3/29/2024 |
| Next Release Date: 4/30/2024 |