|
Download Data (XLS File) |
|
||||||||
|
||||||||
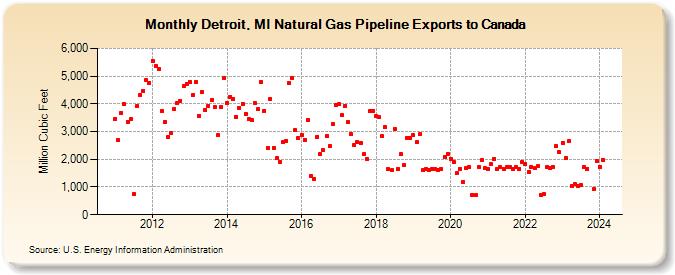
| Detroit, MI Natural Gas Pipeline Exports to Canada (Million Cubic Feet) | ||||||||
| Year | Jan | Feb | Mar | Apr | May | Jun | Jul | Aug | Sep | Oct | Nov | Dec |
|---|---|---|---|---|---|---|---|---|---|---|---|---|
| 2011 | 3,465 | 2,693 | 3,676 | 3,988 | 3,357 | 3,437 | 765 | 3,916 | 4,318 | 4,473 | 4,851 | 4,752 |
| 2012 | 5,562 | 5,372 | 5,253 | 3,745 | 3,354 | 2,811 | 2,935 | 3,822 | 4,015 | 4,113 | 4,636 | 4,728 |
| 2013 | 4,791 | 4,331 | 4,801 | 3,571 | 4,430 | 3,769 | 3,933 | 4,131 | 3,885 | 2,862 | 3,886 | 4,945 |
| 2014 | 4,042 | 4,259 | 4,171 | 3,540 | 3,852 | 4,008 | 3,643 | 3,461 | 3,414 | 4,013 | 3,800 | 4,779 |
| 2015 | 3,753 | 2,420 | 4,176 | 2,416 | 2,035 | 1,911 | 2,624 | 2,674 | 4,755 | 4,944 | 3,048 | 2,773 |
| 2016 | 2,881 | 2,701 | 3,427 | 1,402 | 1,301 | 2,806 | 2,190 | 2,324 | 2,833 | 2,480 | 3,258 | 3,955 |
| 2017 | 3,983 | 3,595 | 3,939 | 3,327 | 2,910 | 2,522 | 2,608 | 2,602 | 2,180 | 2,007 | 3,732 | 3,759 |
| 2018 | 3,559 | 3,514 | 2,833 | 3,154 | 1,651 | 1,598 | 3,101 | 1,651 | 2,173 | 1,786 | 2,783 | 2,785 |
| 2019 | 2,858 | 2,618 | 2,900 | 1,597 | 1,649 | 1,597 | 1,644 | 1,650 | 1,597 | 1,648 | 2,082 | 2,191 |
| 2020 | 2,022 | 1,892 | 1,502 | 1,666 | 1,187 | 1,668 | 1,723 | 722 | 699 | 1,723 | 1,959 | 1,684 |
| 2021 | 1,647 | 1,819 | 2,020 | 1,661 | 1,717 | 1,661 | 1,717 | 1,716 | 1,661 | 1,716 | 1,660 | 1,907 |
| 2022 | 1,821 | 1,547 | 1,732 | 1,681 | 1,740 | 727 | 751 | 1,715 | 1,688 | 1,714 | 2,477 | 2,246 |
| 2023 | 2,599 | 2,057 | 2,644 | 1,047 | 1,108 | 1,020 | 1,055 | 1,718 | 1,662 | 923 | 1,925 | |
| 2024 | 1,731 | 1,985 | ||||||||||
| - = No Data Reported; -- = Not Applicable; NA = Not Available; W = Withheld to avoid disclosure of individual company data. |
| Release Date: 4/30/2024 |
| Next Release Date: 5/31/2024 |