|
Download Data (XLS File) |
|
||||||||
|
||||||||
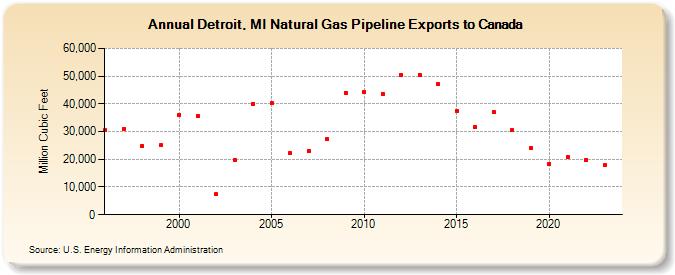
| Detroit, MI Natural Gas Pipeline Exports to Canada (Million Cubic Feet) | ||||||||
| Decade | Year-0 | Year-1 | Year-2 | Year-3 | Year-4 | Year-5 | Year-6 | Year-7 | Year-8 | Year-9 |
|---|---|---|---|---|---|---|---|---|---|---|
| 1990's | 30,410 | 31,080 | 24,908 | 25,049 | ||||||
| 2000's | 36,007 | 35,644 | 7,431 | 19,737 | 40,030 | 40,255 | 22,156 | 22,904 | 27,220 | 43,980 |
| 2010's | 44,275 | 43,690 | 50,347 | 50,439 | 46,981 | 37,528 | 31,558 | 37,164 | 30,589 | 24,030 |
| 2020's | 18,446 | 20,900 | 19,840 | 17,759 |
| - = No Data Reported; -- = Not Applicable; NA = Not Available; W = Withheld to avoid disclosure of individual company data. |
| Release Date: 4/30/2024 |
| Next Release Date: 5/31/2024 |