|
Download Data (XLS File) |
|
||||||||
|
||||||||
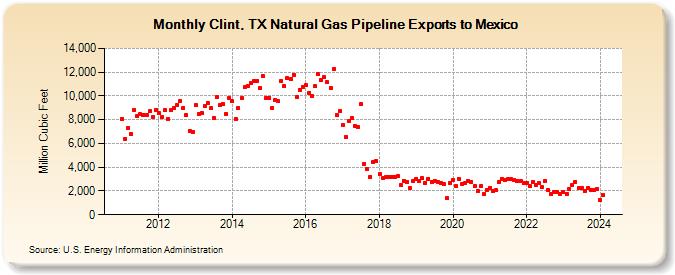
| Clint, TX Natural Gas Pipeline Exports to Mexico (Million Cubic Feet) | ||||||||
| Year | Jan | Feb | Mar | Apr | May | Jun | Jul | Aug | Sep | Oct | Nov | Dec |
|---|---|---|---|---|---|---|---|---|---|---|---|---|
| 2011 | 8,088 | 6,402 | 7,296 | 6,783 | 8,836 | 8,269 | 8,446 | 8,426 | 8,391 | 8,707 | 8,242 | 8,835 |
| 2012 | 8,532 | 8,205 | 8,778 | 8,084 | 8,785 | 9,016 | 9,247 | 9,565 | 8,973 | 8,388 | 7,076 | 6,935 |
| 2013 | 9,196 | 8,473 | 8,533 | 9,141 | 9,363 | 8,941 | 8,169 | 9,913 | 9,206 | 9,303 | 8,502 | 9,834 |
| 2014 | 9,531 | 8,079 | 8,962 | 9,815 | 10,710 | 10,862 | 11,053 | 11,252 | 11,285 | 10,649 | 11,636 | 9,836 |
| 2015 | 9,847 | 8,967 | 9,685 | 9,542 | 11,218 | 10,795 | 11,494 | 11,429 | 11,802 | 9,933 | 10,528 | 10,783 |
| 2016 | 10,886 | 10,268 | 9,973 | 10,806 | 11,804 | 11,321 | 11,559 | 11,130 | 10,701 | 12,259 | 8,352 | 8,708 |
| 2017 | 7,551 | 6,551 | 7,907 | 8,104 | 7,509 | 7,420 | 9,295 | 4,296 | 3,835 | 3,201 | 4,447 | 4,530 |
| 2018 | 3,424 | 3,082 | 3,151 | 3,138 | 3,178 | 3,172 | 3,274 | 2,478 | 2,865 | 2,792 | 2,215 | 2,817 |
| 2019 | 3,042 | 2,872 | 3,066 | 2,681 | 3,042 | 2,780 | 2,851 | 2,778 | 2,709 | 2,554 | 1,406 | 2,648 |
| 2020 | 2,912 | 2,397 | 3,043 | 2,571 | 2,635 | 2,859 | 2,779 | 2,401 | 1,977 | 2,380 | 1,739 | 2,104 |
| 2021 | 2,272 | 1,970 | 2,053 | 2,753 | 3,019 | 2,935 | 2,968 | 2,980 | 2,900 | 2,860 | 2,801 | 2,643 |
| 2022 | 2,707 | 2,416 | 2,761 | 2,503 | 2,643 | 2,314 | 2,828 | 2,043 | 1,715 | 1,887 | 1,901 | 1,783 |
| 2023 | 1,892 | 1,773 | 2,134 | 2,533 | 2,787 | 2,244 | 2,252 | 1,961 | 2,289 | 2,102 | 2,050 | 2,194 |
| 2024 | 1,277 | 1,651 | ||||||||||
| - = No Data Reported; -- = Not Applicable; NA = Not Available; W = Withheld to avoid disclosure of individual company data. |
| Release Date: 4/30/2024 |
| Next Release Date: 5/31/2024 |