|
Download Data (XLS File) |
|
||||||||
|
||||||||
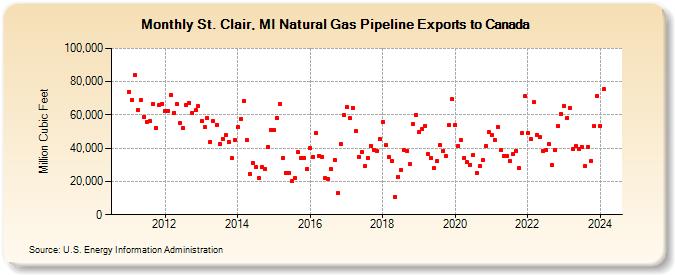
| St. Clair, MI Natural Gas Pipeline Exports to Canada (Million Cubic Feet) | ||||||||
| Year | Jan | Feb | Mar | Apr | May | Jun | Jul | Aug | Sep | Oct | Nov | Dec |
|---|---|---|---|---|---|---|---|---|---|---|---|---|
| 2011 | 74,025 | 68,809 | 83,796 | 62,851 | 68,731 | 59,044 | 56,015 | 56,094 | 66,775 | 52,380 | 65,815 | 66,723 |
| 2012 | 62,390 | 62,442 | 72,035 | 61,364 | 66,456 | 54,973 | 52,240 | 66,101 | 67,443 | 61,205 | 62,762 | 65,084 |
| 2013 | 56,510 | 52,567 | 58,126 | 43,917 | 56,075 | 54,114 | 42,609 | 45,524 | 47,795 | 43,767 | 34,054 | 45,093 |
| 2014 | 52,731 | 57,817 | 68,448 | 44,792 | 24,659 | 31,385 | 28,556 | 21,997 | 28,757 | 27,488 | 40,820 | 51,194 |
| 2015 | 50,905 | 58,264 | 66,483 | 34,226 | 25,282 | 24,830 | 20,051 | 22,111 | 37,442 | 34,246 | 34,326 | 27,579 |
| 2016 | 40,140 | 34,965 | 49,094 | 35,597 | 34,972 | 21,831 | 21,562 | 27,186 | 32,941 | 13,196 | 42,650 | 59,946 |
| 2017 | 64,526 | 57,870 | 64,395 | 50,346 | 34,788 | 37,598 | 29,108 | 34,367 | 41,581 | 39,111 | 38,132 | 45,384 |
| 2018 | 55,782 | 41,781 | 34,548 | 32,195 | 10,935 | 22,939 | 26,974 | 38,617 | 38,599 | 30,289 | 54,505 | 60,241 |
| 2019 | 49,568 | 51,501 | 53,395 | 36,370 | 34,138 | 27,874 | 32,130 | 41,714 | 38,491 | 35,057 | 54,052 | 69,420 |
| 2020 | 53,801 | 41,207 | 44,698 | 34,234 | 31,406 | 30,176 | 36,023 | 25,099 | 29,069 | 32,797 | 41,591 | 49,521 |
| 2021 | 48,118 | 44,713 | 52,731 | 38,780 | 35,172 | 35,046 | 32,325 | 36,408 | 38,577 | 27,921 | 48,961 | 71,120 |
| 2022 | 49,122 | 45,236 | 67,491 | 48,219 | 46,473 | 38,009 | 38,706 | 42,652 | 29,921 | 38,791 | 53,440 | 60,730 |
| 2023 | 65,346 | 58,320 | 64,285 | 39,376 | 41,080 | 39,285 | 40,627 | 29,348 | 41,009 | 32,389 | 53,221 | 71,369 |
| 2024 | 53,544 | 75,298 | ||||||||||
| - = No Data Reported; -- = Not Applicable; NA = Not Available; W = Withheld to avoid disclosure of individual company data. |
| Release Date: 4/30/2024 |
| Next Release Date: 5/31/2024 |