|
Download Data (XLS File) |
|
||||||||
|
||||||||
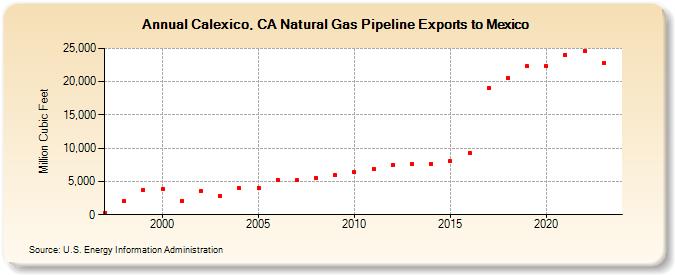
| Calexico, CA Natural Gas Pipeline Exports to Mexico (Million Cubic Feet) | ||||||||
| Decade | Year-0 | Year-1 | Year-2 | Year-3 | Year-4 | Year-5 | Year-6 | Year-7 | Year-8 | Year-9 |
|---|---|---|---|---|---|---|---|---|---|---|
| 1990's | 308 | 2,067 | 3,724 | |||||||
| 2000's | 3,921 | 2,124 | 3,580 | 2,836 | 3,953 | 4,083 | 5,291 | 5,147 | 5,534 | 5,944 |
| 2010's | 6,388 | 6,938 | 7,486 | 7,683 | 7,657 | 8,043 | 9,347 | 19,099 | 20,557 | 22,311 |
| 2020's | 22,338 | 24,063 | 24,643 | 22,877 |
| - = No Data Reported; -- = Not Applicable; NA = Not Available; W = Withheld to avoid disclosure of individual company data. |
| Release Date: 3/29/2024 |
| Next Release Date: 4/30/2024 |