|
Download Data (XLS File) |
|
||||||||
|
||||||||
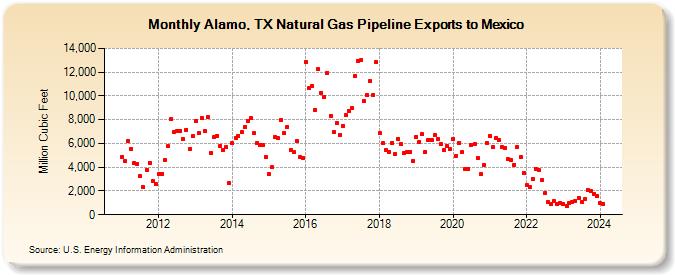
| Alamo, TX Natural Gas Pipeline Exports to Mexico (Million Cubic Feet) | ||||||||
| Year | Jan | Feb | Mar | Apr | May | Jun | Jul | Aug | Sep | Oct | Nov | Dec |
|---|---|---|---|---|---|---|---|---|---|---|---|---|
| 2011 | 4,883 | 4,482 | 6,210 | 5,559 | 4,365 | 4,278 | 3,237 | 2,294 | 3,772 | 4,389 | 2,801 | 2,579 |
| 2012 | 3,464 | 3,440 | 4,584 | 5,780 | 8,021 | 6,979 | 7,067 | 7,085 | 6,335 | 7,164 | 5,513 | 6,608 |
| 2013 | 7,883 | 6,882 | 8,155 | 7,039 | 8,210 | 5,211 | 6,512 | 6,657 | 5,799 | 5,423 | 5,696 | 2,644 |
| 2014 | 6,013 | 6,496 | 6,658 | 6,962 | 7,388 | 7,865 | 8,101 | 6,852 | 6,008 | 5,844 | 5,840 | 4,837 |
| 2015 | 3,440 | 3,990 | 6,547 | 6,431 | 7,980 | 6,896 | 7,411 | 5,451 | 5,292 | 6,185 | 4,875 | 4,771 |
| 2016 | 12,859 | 10,643 | 10,863 | 8,838 | 12,225 | 10,249 | 9,902 | 11,970 | 8,342 | 6,962 | 7,689 | 6,741 |
| 2017 | 7,502 | 8,361 | 8,745 | 8,980 | 11,670 | 12,959 | 13,014 | 9,591 | 10,037 | 11,276 | 10,095 | 12,813 |
| 2018 | 6,837 | 6,003 | 5,438 | 5,258 | 6,060 | 5,078 | 6,397 | 5,951 | 5,217 | 5,245 | 5,283 | 4,529 |
| 2019 | 6,555 | 6,149 | 6,771 | 5,282 | 6,331 | 6,308 | 6,686 | 6,373 | 5,917 | 5,447 | 5,792 | 5,508 |
| 2020 | 6,350 | 4,956 | 6,033 | 5,263 | 3,863 | 3,868 | 5,904 | 5,968 | 4,776 | 3,416 | 4,197 | 6,053 |
| 2021 | 6,665 | 5,677 | 6,449 | 6,308 | 5,714 | 5,626 | 4,662 | 4,579 | 4,223 | 5,713 | 4,865 | 3,549 |
| 2022 | 2,469 | 2,315 | 3,045 | 3,856 | 3,740 | 2,889 | 1,802 | 1,068 | 862 | 1,131 | 888 | 994 |
| 2023 | 868 | 768 | 964 | 1,098 | 1,156 | 1,409 | 1,057 | 1,282 | 2,055 | 1,966 | 1,749 | 1,556 |
| 2024 | 955 | 914 | ||||||||||
| - = No Data Reported; -- = Not Applicable; NA = Not Available; W = Withheld to avoid disclosure of individual company data. |
| Release Date: 4/30/2024 |
| Next Release Date: 5/31/2024 |