|
Download Data (XLS File) |
|
||||||||
|
||||||||
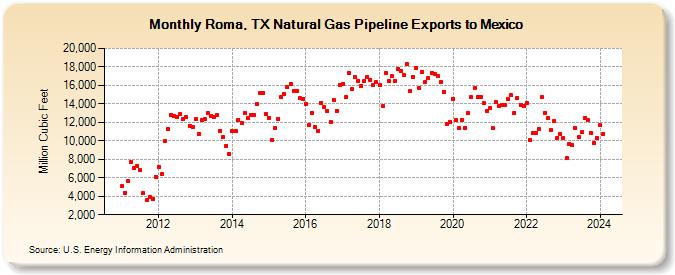
| Roma, TX Natural Gas Pipeline Exports to Mexico (Million Cubic Feet) | ||||||||
| Year | Jan | Feb | Mar | Apr | May | Jun | Jul | Aug | Sep | Oct | Nov | Dec |
|---|---|---|---|---|---|---|---|---|---|---|---|---|
| 2011 | 5,096 | 4,366 | 5,682 | 7,739 | 7,085 | 7,322 | 6,867 | 4,309 | 3,565 | 3,941 | 3,724 | 6,098 |
| 2012 | 7,203 | 6,395 | 9,986 | 11,277 | 12,777 | 12,656 | 12,587 | 12,852 | 12,403 | 12,529 | 11,604 | 11,500 |
| 2013 | 12,364 | 10,749 | 12,263 | 12,320 | 13,026 | 12,678 | 12,542 | 12,790 | 11,100 | 10,410 | 9,480 | 8,619 |
| 2014 | 11,008 | 11,039 | 12,280 | 11,962 | 12,995 | 12,455 | 12,784 | 12,812 | 13,937 | 15,124 | 15,124 | 12,951 |
| 2015 | 12,494 | 10,114 | 11,377 | 12,397 | 14,689 | 15,053 | 15,779 | 16,165 | 15,423 | 15,404 | 14,585 | 14,568 |
| 2016 | 13,965 | 11,742 | 13,041 | 11,507 | 11,095 | 14,126 | 13,666 | 13,213 | 12,049 | 14,417 | 13,247 | 16,039 |
| 2017 | 16,103 | 14,697 | 17,285 | 15,556 | 16,893 | 16,499 | 15,940 | 16,484 | 16,878 | 16,606 | 16,082 | 16,380 |
| 2018 | 16,010 | 13,748 | 17,327 | 16,464 | 16,997 | 16,510 | 17,783 | 17,535 | 17,112 | 18,275 | 15,343 | 16,951 |
| 2019 | 17,869 | 15,737 | 17,462 | 16,400 | 16,813 | 17,354 | 17,275 | 17,034 | 16,343 | 15,325 | 11,869 | 12,049 |
| 2020 | 14,551 | 12,229 | 11,374 | 12,251 | 11,391 | 13,019 | 14,705 | 15,705 | 14,767 | 14,689 | 14,084 | 13,274 |
| 2021 | 13,518 | 11,376 | 14,205 | 13,768 | 13,885 | 13,870 | 14,514 | 14,924 | 13,039 | 14,612 | 13,922 | 13,812 |
| 2022 | 14,143 | 10,080 | 10,835 | 10,840 | 11,302 | 14,712 | 13,032 | 12,482 | 11,166 | 12,160 | 10,321 | 10,706 |
| 2023 | 10,300 | 8,085 | 9,613 | 9,531 | 11,383 | 10,364 | 10,898 | 12,486 | 12,210 | 10,896 | 9,780 | 10,343 |
| 2024 | 11,681 | |||||||||||
| - = No Data Reported; -- = Not Applicable; NA = Not Available; W = Withheld to avoid disclosure of individual company data. |
| Release Date: 3/29/2024 |
| Next Release Date: 4/30/2024 |