|
Download Data (XLS File) |
|
||||||||
|
||||||||
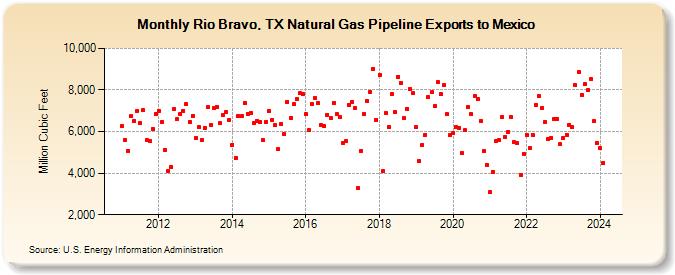
| Rio Bravo, TX Natural Gas Pipeline Exports to Mexico (Million Cubic Feet) | ||||||||
| Year | Jan | Feb | Mar | Apr | May | Jun | Jul | Aug | Sep | Oct | Nov | Dec |
|---|---|---|---|---|---|---|---|---|---|---|---|---|
| 2011 | 6,264 | 5,596 | 5,084 | 6,745 | 6,527 | 7,001 | 6,404 | 7,024 | 5,603 | 5,556 | 6,129 | 6,857 |
| 2012 | 7,001 | 6,473 | 5,109 | 4,087 | 4,285 | 7,082 | 6,586 | 6,845 | 7,001 | 7,306 | 6,482 | 6,770 |
| 2013 | 5,681 | 6,205 | 5,607 | 6,193 | 7,167 | 6,327 | 7,125 | 7,201 | 6,390 | 6,810 | 6,945 | 6,546 |
| 2014 | 5,377 | 4,717 | 6,745 | 6,735 | 7,381 | 6,865 | 6,894 | 6,408 | 6,520 | 6,460 | 5,578 | 6,475 |
| 2015 | 6,981 | 6,575 | 6,308 | 5,147 | 6,340 | 5,880 | 7,442 | 6,641 | 7,325 | 7,558 | 7,837 | 7,802 |
| 2016 | 6,841 | 6,062 | 7,330 | 7,615 | 7,373 | 6,306 | 6,247 | 6,809 | 6,673 | 7,395 | 6,833 | 6,716 |
| 2017 | 5,462 | 5,526 | 7,298 | 7,437 | 7,149 | 3,280 | 5,083 | 6,843 | 7,458 | 7,909 | 9,029 | 6,574 |
| 2018 | 8,710 | 4,081 | 6,893 | 6,215 | 7,813 | 6,925 | 8,636 | 8,339 | 6,633 | 7,098 | 8,043 | 7,833 |
| 2019 | 6,206 | 4,586 | 5,360 | 5,857 | 7,641 | 7,889 | 7,209 | 8,364 | 7,790 | 8,223 | 6,829 | 5,831 |
| 2020 | 5,928 | 6,200 | 6,183 | 4,964 | 6,052 | 7,184 | 6,822 | 7,708 | 7,548 | 6,525 | 5,044 | 4,406 |
| 2021 | 3,079 | 4,074 | 5,568 | 5,584 | 6,699 | 5,750 | 5,994 | 6,681 | 5,477 | 5,451 | 3,929 | 4,933 |
| 2022 | 5,854 | 5,193 | 5,836 | 7,287 | 7,704 | 7,143 | 6,467 | 5,664 | 5,706 | 6,612 | 6,595 | 5,387 |
| 2023 | 5,710 | 5,854 | 6,338 | 6,202 | 8,225 | 8,862 | 7,777 | 8,280 | 7,991 | 8,520 | 6,495 | 5,467 |
| 2024 | 5,191 | 4,487 | ||||||||||
| - = No Data Reported; -- = Not Applicable; NA = Not Available; W = Withheld to avoid disclosure of individual company data. |
| Release Date: 4/30/2024 |
| Next Release Date: 5/31/2024 |