|
Download Data (XLS File) |
|
|||||
|
|||||
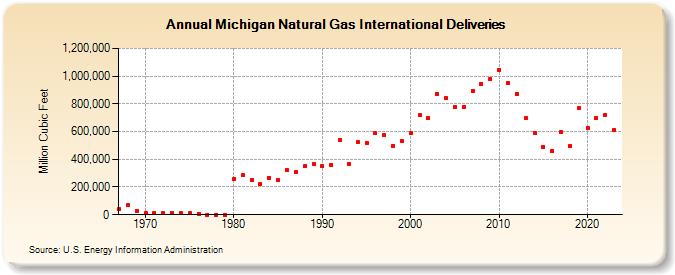
| Michigan Natural Gas International Deliveries (Million Cubic Feet) | |||||
| Decade | Year-0 | Year-1 | Year-2 | Year-3 | Year-4 | Year-5 | Year-6 | Year-7 | Year-8 | Year-9 |
|---|---|---|---|---|---|---|---|---|---|---|
| 1960's | 40,418 | 68,044 | 29,765 | |||||||
| 1970's | 10,643 | 14,236 | 15,426 | 14,736 | 13,232 | 10,153 | 7,461 | 0 | 0 | 0 |
| 1980's | 256,152 | 283,347 | 251,634 | 218,264 | 265,904 | 249,918 | 321,194 | 306,724 | 349,054 | 363,680 |
| 1990's | 349,146 | 361,041 | 539,369 | 368,505 | 521,969 | 519,430 | 586,696 | 573,066 | 499,144 | 531,542 |
| 2000's | 587,546 | 717,001 | 697,131 | 872,613 | 842,312 | 774,549 | 779,755 | 893,838 | 943,174 | 982,237 |
| 2010's | 1,046,280 | 950,499 | 872,620 | 695,908 | 589,839 | 490,112 | 457,780 | 596,815 | 496,830 | 768,025 |
| 2020's | 626,858 | 699,523 | 721,223 |
| - = No Data Reported; -- = Not Applicable; NA = Not Available; W = Withheld to avoid disclosure of individual company data. |
| Release Date: 3/29/2024 |
| Next Release Date: 4/30/2024 |