|
Download Data (XLS File) |
|
|||||
|
|||||
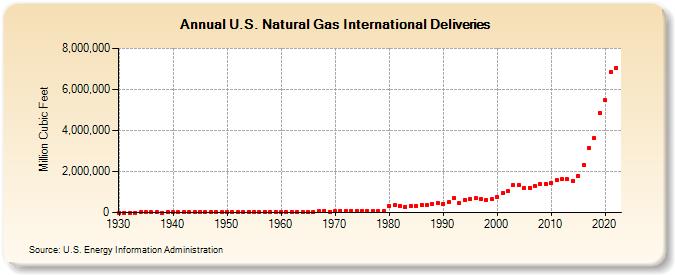
| U.S. Natural Gas International Deliveries (Million Cubic Feet) | |||||
| Decade | Year-0 | Year-1 | Year-2 | Year-3 | Year-4 | Year-5 | Year-6 | Year-7 | Year-8 | Year-9 |
|---|---|---|---|---|---|---|---|---|---|---|
| 1930's | 1,798 | 2,231 | 1,693 | 2,158 | 5,801 | 6,800 | 7,436 | 4,868 | 1,837 | 3,122 |
| 1940's | 5,563 | 7,466 | 8,702 | 11,210 | 14,576 | 18,207 | 17,675 | 18,149 | 18,704 | 20,054 |
| 1950's | 25,727 | 24,163 | 27,456 | 28,322 | 28,726 | 31,029 | 35,963 | 41,655 | 38,719 | 18,413 |
| 1960's | 11,332 | 10,747 | 15,814 | 16,957 | 19,603 | 26,132 | 24,639 | 81,614 | 93,745 | 51,304 |
| 1970's | 69,813 | 80,212 | 78,013 | 77,169 | 76,789 | 72,675 | 64,711 | 55,626 | 52,532 | 55,673 |
| 1980's | 330,080 | 364,724 | 321,611 | 291,393 | 341,489 | 325,376 | 389,030 | 374,464 | 426,988 | 453,682 |
| 1990's | 441,253 | 491,832 | 702,442 | 464,276 | 634,238 | 646,600 | 689,725 | 673,625 | 618,468 | 657,959 |
| 2000's | 760,281 | 948,149 | 1,046,696 | 1,328,187 | 1,353,042 | 1,187,746 | 1,210,815 | 1,284,392 | 1,375,317 | 1,381,276 |
| 2010's | 1,462,073 | 1,579,881 | 1,622,167 | 1,613,727 | 1,549,405 | 1,788,675 | 2,339,998 | 3,153,931 | 3,632,704 | 4,873,097 |
| 2020's | 5,461,746 | 6,840,705 | 7,056,188 |
| - = No Data Reported; -- = Not Applicable; NA = Not Available; W = Withheld to avoid disclosure of individual company data. |
| Release Date: 3/29/2024 |
| Next Release Date: 4/30/2024 |