|
Download Data (XLS File) |
|
||||||||
|
||||||||
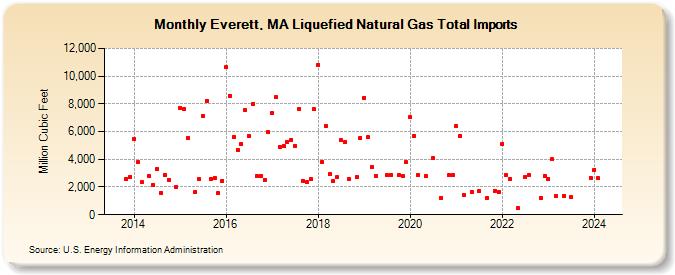
| Everett, MA Liquefied Natural Gas Total Imports (Million Cubic Feet) | ||||||||
| Year | Jan | Feb | Mar | Apr | May | Jun | Jul | Aug | Sep | Oct | Nov | Dec |
|---|---|---|---|---|---|---|---|---|---|---|---|---|
| 2013 | 2,583 | 2,728 | ||||||||||
| 2014 | 5,470 | 3,783 | 2,334 | 2,806 | 2,175 | 3,311 | 1,567 | 2,871 | 2,505 | 2,003 | ||
| 2015 | 7,729 | 7,623 | 5,521 | 1,673 | 2,557 | 7,133 | 8,237 | 2,563 | 2,653 | 1,541 | 2,452 | |
| 2016 | 10,633 | 8,593 | 5,626 | 4,693 | 5,087 | 7,520 | 5,703 | 7,998 | 2,810 | 2,798 | 2,528 | 5,939 |
| 2017 | 7,315 | 8,468 | 4,870 | 4,985 | 5,275 | 5,425 | 4,974 | 7,636 | 2,467 | 2,337 | 2,567 | 7,617 |
| 2018 | 10,829 | 3,830 | 6,419 | 2,934 | 2,429 | 2,688 | 5,376 | 5,231 | 2,600 | 2,734 | 5,566 | |
| 2019 | 8,447 | 5,583 | 3,456 | 2,811 | 2,832 | 2,886 | 2,836 | 2,780 | 3,775 | |||
| 2020 | 7,031 | 5,689 | 2,857 | 2,811 | 4,078 | 1,235 | 2,841 | 2,853 | ||||
| 2021 | 6,376 | 5,688 | 1,406 | 1,662 | 1,714 | 1,221 | 1,729 | 1,628 | ||||
| 2022 | 5,135 | 2,855 | 2,600 | 482 | 2,736 | 2,862 | 1,216 | 2,810 | ||||
| 2023 | 2,587 | 3,992 | 1,324 | 1,370 | 1,257 | 2,657 | ||||||
| 2024 | 3,261 | 2,620 | ||||||||||
| - = No Data Reported; -- = Not Applicable; NA = Not Available; W = Withheld to avoid disclosure of individual company data. |
| Release Date: 4/30/2024 |
| Next Release Date: 5/31/2024 |