|
Download Data (XLS File) |
|
||||||||
|
||||||||
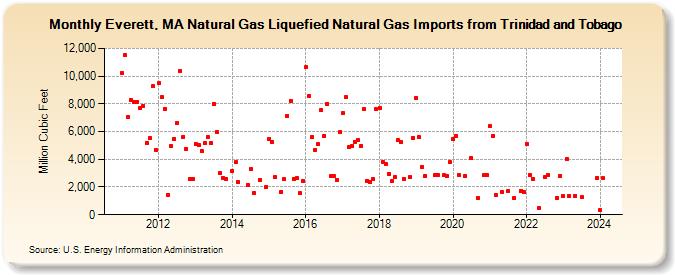
| Everett, MA Natural Gas Liquefied Natural Gas Imports from Trinidad and Tobago (Million Cubic Feet) | ||||||||
| Year | Jan | Feb | Mar | Apr | May | Jun | Jul | Aug | Sep | Oct | Nov | Dec |
|---|---|---|---|---|---|---|---|---|---|---|---|---|
| 2011 | 10,240 | 11,488 | 7,086 | 8,271 | 8,126 | 8,150 | 7,731 | 7,870 | 5,199 | 5,520 | 9,264 | 4,691 |
| 2012 | 9,482 | 8,458 | 7,661 | 1,447 | 4,940 | 5,465 | 6,646 | 10,377 | 5,634 | 4,748 | 2,553 | 2,581 |
| 2013 | 5,126 | 5,003 | 4,629 | 5,171 | 5,626 | 5,173 | 8,023 | 5,961 | 2,995 | 2,674 | 2,583 | |
| 2014 | 3,141 | 3,783 | 2,334 | 2,175 | 3,311 | 1,567 | 2,505 | 2,003 | ||||
| 2015 | 5,495 | 5,251 | 2,687 | 1,673 | 2,557 | 7,133 | 8,237 | 2,563 | 2,653 | 1,541 | 2,452 | |
| 2016 | 10,633 | 8,593 | 5,626 | 4,693 | 5,087 | 7,520 | 5,703 | 7,998 | 2,810 | 2,798 | 2,528 | 5,939 |
| 2017 | 7,315 | 8,468 | 4,870 | 4,985 | 5,275 | 5,425 | 4,974 | 7,636 | 2,467 | 2,337 | 2,567 | 7,617 |
| 2018 | 7,710 | 3,830 | 3,650 | 2,934 | 2,429 | 2,688 | 5,376 | 5,231 | 2,600 | 2,734 | 5,566 | |
| 2019 | 8,447 | 5,583 | 3,456 | 2,811 | 2,832 | 2,886 | 2,836 | 2,780 | 3,775 | |||
| 2020 | 5,447 | 5,689 | 2,857 | 2,811 | 4,078 | 1,235 | 2,841 | 2,853 | ||||
| 2021 | 6,376 | 5,688 | 1,406 | 1,662 | 1,714 | 1,221 | 1,729 | 1,628 | ||||
| 2022 | 5,135 | 2,855 | 2,600 | 482 | 2,736 | 2,862 | 1,216 | 2,810 | ||||
| 2023 | 1,329 | 3,992 | 1,324 | 1,370 | 1,257 | 2,657 | ||||||
| 2024 | 324 | |||||||||||
| - = No Data Reported; -- = Not Applicable; NA = Not Available; W = Withheld to avoid disclosure of individual company data. |
| Release Date: 3/29/2024 |
| Next Release Date: 4/30/2024 |