|
Download Data (XLS File) |
|
||||||||
|
||||||||
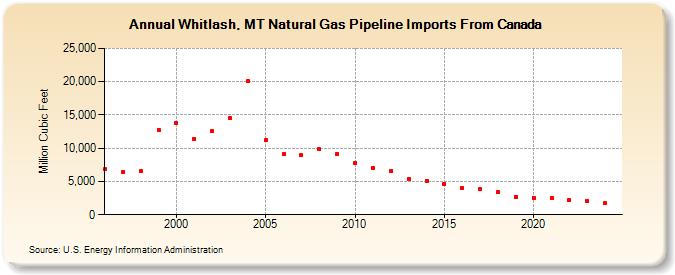
| Whitlash, MT Natural Gas Pipeline Imports From Canada (Million Cubic Feet) | ||||||||
| Decade | Year-0 | Year-1 | Year-2 | Year-3 | Year-4 | Year-5 | Year-6 | Year-7 | Year-8 | Year-9 |
|---|---|---|---|---|---|---|---|---|---|---|
| 1990's | 6,820 | 6,420 | 6,533 | 12,767 | ||||||
| 2000's | 13,733 | 11,428 | 12,558 | 14,475 | 20,069 | 11,157 | 9,120 | 8,945 | 9,834 | 9,195 |
| 2010's | 7,707 | 7,062 | 6,571 | 5,387 | 5,128 | 4,651 | 4,075 | 3,931 | 3,447 | 2,733 |
| 2020's | 2,551 | 2,525 | 2,208 | 2,086 |
| - = No Data Reported; -- = Not Applicable; NA = Not Available; W = Withheld to avoid disclosure of individual company data. |
| Release Date: 4/30/2024 |
| Next Release Date: 5/31/2024 |