|
Download Data (XLS File) |
|
||||||||
|
||||||||
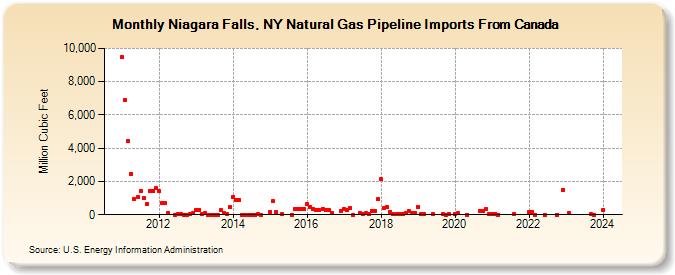
| Niagara Falls, NY Natural Gas Pipeline Imports From Canada (Million Cubic Feet) | ||||||||
| Year | Jan | Feb | Mar | Apr | May | Jun | Jul | Aug | Sep | Oct | Nov | Dec |
|---|---|---|---|---|---|---|---|---|---|---|---|---|
| 2011 | 9,497 | 6,894 | 4,421 | 2,459 | 935 | 1,060 | 1,452 | 979 | 644 | 1,443 | 1,404 | 1,583 |
| 2012 | 1,411 | 720 | 681 | 93 | 7 | 56 | 31 | 6 | 12 | 35 | 105 | |
| 2013 | 299 | 291 | 49 | 103 | 12 | 0 | 0 | 6 | 281 | 97 | 41 | 471 |
| 2014 | 1,092 | 908 | 893 | 0 | 0 | 0 | 0 | 0 | 57 | 6 | ||
| 2015 | 168 | 796 | 162 | 23 | 6 | 356 | 351 | 333 | 346 | |||
| 2016 | 618 | 462 | 347 | 277 | 298 | 358 | 288 | 278 | 111 | 244 | ||
| 2017 | 338 | 281 | 375 | 1 | 87 | 50 | 75 | 21 | 246 | 242 | 915 | |
| 2018 | 2,122 | 432 | 474 | 186 | 29 | 33 | 65 | 47 | 100 | 196 | 88 | 108 |
| 2019 | 483 | 22 | 35 | 30 | 16 | 8 | 41 | |||||
| 2020 | 49 | 74 | 6 | 251 | 240 | 348 | 38 | |||||
| 2021 | 50 | 73 | 6 | 26 | ||||||||
| 2022 | 134 | 136 | 0 | 0 | 11 | 1,493 | ||||||
| 2023 | 74 | 25 | 0 | |||||||||
| 2024 | 303 | |||||||||||
| - = No Data Reported; -- = Not Applicable; NA = Not Available; W = Withheld to avoid disclosure of individual company data. |
| Release Date: 3/29/2024 |
| Next Release Date: 4/30/2024 |