|
Download Data (XLS File) |
|
||||||||
|
||||||||
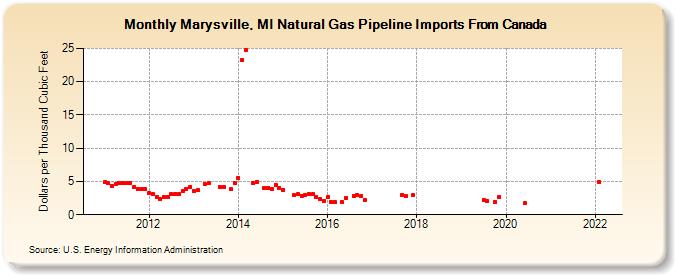
| Marysville, MI Natural Gas Pipeline Imports From Canada (Dollars per Thousand Cubic Feet) | ||||||||
| Year | Jan | Feb | Mar | Apr | May | Jun | Jul | Aug | Sep | Oct | Nov | Dec |
|---|---|---|---|---|---|---|---|---|---|---|---|---|
| 2011 | 4.85 | 4.76 | 4.36 | 4.62 | 4.73 | 4.70 | 4.74 | 4.75 | 4.21 | 3.83 | 3.85 | 3.79 |
| 2012 | 3.29 | 3.05 | 2.61 | 2.35 | 2.68 | 2.64 | 3.07 | 3.16 | 3.14 | 3.60 | 3.93 | 4.22 |
| 2013 | 3.63 | 3.65 | 4.57 | 4.70 | 4.22 | 4.17 | 3.79 | 4.78 | ||||
| 2014 | 5.52 | 23.30 | 24.73 | 4.80 | 4.99 | 4.06 | 4.09 | 3.92 | 4.51 | 4.03 | ||
| 2015 | 3.74 | 2.89 | 3.07 | 2.86 | 2.94 | 3.05 | 3.11 | 2.63 | 2.29 | 2.03 | ||
| 2016 | 2.61 | 1.92 | 1.91 | 1.90 | 2.52 | 2.87 | 2.99 | 2.82 | 2.26 | |||
| 2017 | 3.02 | 2.82 | 2.93 | |||||||||
| 2019 | 2.19 | 2.05 | 1.92 | 2.64 | ||||||||
| 2020 | 1.69 | |||||||||||
| 2022 | 4.88 | |||||||||||
| - = No Data Reported; -- = Not Applicable; NA = Not Available; W = Withheld to avoid disclosure of individual company data. |
| Release Date: 4/30/2024 |
| Next Release Date: 5/31/2024 |