|
Download Data (XLS File) |
|
||||||||
|
||||||||
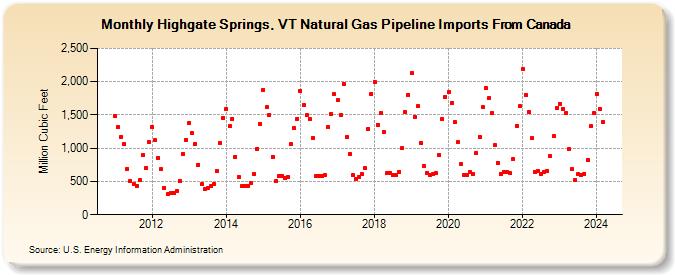
| Highgate Springs, VT Natural Gas Pipeline Imports From Canada (Million Cubic Feet) | ||||||||
| Year | Jan | Feb | Mar | Apr | May | Jun | Jul | Aug | Sep | Oct | Nov | Dec |
|---|---|---|---|---|---|---|---|---|---|---|---|---|
| 2011 | 1,477 | 1,317 | 1,172 | 1,059 | 690 | 503 | 462 | 433 | 520 | 894 | 706 | 1,086 |
| 2012 | 1,322 | 1,116 | 858 | 681 | 409 | 309 | 319 | 323 | 357 | 509 | 914 | 1,130 |
| 2013 | 1,385 | 1,223 | 1,070 | 752 | 457 | 386 | 401 | 426 | 467 | 663 | 1,078 | 1,461 |
| 2014 | 1,588 | 1,335 | 1,441 | 872 | 574 | 431 | 433 | 435 | 476 | 616 | 995 | 1,360 |
| 2015 | 1,882 | 1,615 | 1,501 | 874 | 501 | 575 | 581 | 547 | 572 | 1,056 | 1,299 | 1,441 |
| 2016 | 1,866 | 1,651 | 1,493 | 1,440 | 1,156 | 577 | 583 | 577 | 596 | 1,313 | 1,512 | 1,809 |
| 2017 | 1,720 | 1,506 | 1,969 | 1,164 | 919 | 594 | 544 | 570 | 610 | 701 | 1,292 | 1,816 |
| 2018 | 1,996 | 1,355 | 1,530 | 1,250 | 623 | 627 | 595 | 596 | 647 | 1,000 | 1,541 | 1,806 |
| 2019 | 2,128 | 1,470 | 1,627 | 1,078 | 735 | 633 | 599 | 609 | 624 | 895 | 1,436 | 1,772 |
| 2020 | 1,846 | 1,679 | 1,393 | 1,087 | 758 | 594 | 603 | 640 | 609 | 928 | 1,174 | 1,619 |
| 2021 | 1,901 | 1,753 | 1,531 | 1,041 | 784 | 611 | 647 | 644 | 621 | 833 | 1,339 | 1,630 |
| 2022 | 2,183 | 1,802 | 1,545 | 1,146 | 644 | 658 | 614 | 645 | 658 | 876 | 1,182 | 1,609 |
| 2023 | 1,668 | 1,595 | 1,522 | 981 | 686 | 529 | 618 | 597 | 619 | 826 | 1,327 | 1,527 |
| 2024 | 1,818 | 1,595 | ||||||||||
| - = No Data Reported; -- = Not Applicable; NA = Not Available; W = Withheld to avoid disclosure of individual company data. |
| Release Date: 4/30/2024 |
| Next Release Date: 5/31/2024 |