|
Download Data (XLS File) |
|
||||||||
|
||||||||
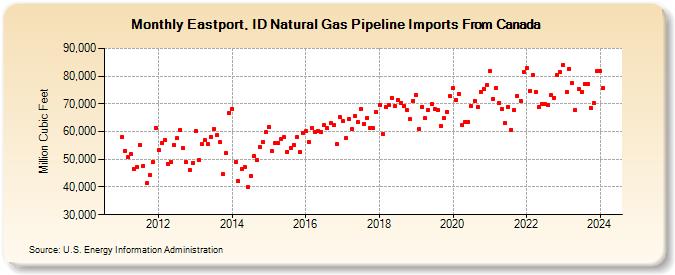
| Eastport, ID Natural Gas Pipeline Imports From Canada (Million Cubic Feet) | ||||||||
| Year | Jan | Feb | Mar | Apr | May | Jun | Jul | Aug | Sep | Oct | Nov | Dec |
|---|---|---|---|---|---|---|---|---|---|---|---|---|
| 2011 | 57,931 | 53,135 | 50,643 | 51,761 | 46,504 | 47,069 | 55,282 | 47,734 | 41,303 | 44,381 | 48,947 | 61,409 |
| 2012 | 53,165 | 55,723 | 56,969 | 48,378 | 48,951 | 55,220 | 57,504 | 60,569 | 53,906 | 48,904 | 46,236 | 48,670 |
| 2013 | 60,123 | 49,586 | 55,341 | 56,795 | 55,526 | 58,195 | 60,900 | 58,601 | 56,380 | 44,662 | 52,087 | 66,721 |
| 2014 | 68,252 | 49,115 | 42,003 | 46,538 | 47,180 | 39,823 | 43,989 | 51,016 | 49,673 | 54,557 | 56,310 | 59,690 |
| 2015 | 61,679 | 52,864 | 55,737 | 55,839 | 57,492 | 57,877 | 52,758 | 54,190 | 55,153 | 57,967 | 52,610 | 59,365 |
| 2016 | 60,176 | 56,199 | 61,171 | 59,996 | 60,100 | 59,906 | 62,245 | 61,185 | 62,921 | 62,214 | 55,369 | 65,210 |
| 2017 | 63,754 | 57,614 | 64,359 | 60,808 | 65,547 | 63,266 | 67,984 | 62,717 | 64,983 | 61,340 | 61,157 | 67,120 |
| 2018 | 69,522 | 59,028 | 68,796 | 69,507 | 72,195 | 69,195 | 71,381 | 70,467 | 69,137 | 67,699 | 64,429 | 71,177 |
| 2019 | 73,152 | 60,964 | 68,865 | 64,748 | 67,733 | 69,913 | 68,139 | 67,829 | 62,066 | 64,875 | 67,206 | 72,675 |
| 2020 | 75,696 | 71,493 | 73,501 | 62,249 | 63,430 | 63,468 | 69,196 | 70,966 | 68,820 | 74,426 | 75,414 | 76,682 |
| 2021 | 81,699 | 71,849 | 75,819 | 70,244 | 67,988 | 62,923 | 68,974 | 60,706 | 67,716 | 72,876 | 71,071 | 81,435 |
| 2022 | 82,748 | 74,717 | 80,456 | 74,319 | 68,843 | 70,027 | 69,773 | 69,468 | 73,154 | 72,277 | 80,282 | 81,426 |
| 2023 | 84,008 | 74,104 | 82,735 | 77,546 | 67,936 | 75,356 | 74,389 | 77,307 | 77,051 | 68,647 | 70,267 | 81,668 |
| 2024 | 81,950 | 75,729 | ||||||||||
| - = No Data Reported; -- = Not Applicable; NA = Not Available; W = Withheld to avoid disclosure of individual company data. |
| Release Date: 4/30/2024 |
| Next Release Date: 5/31/2024 |