|
Download Data (XLS File) |
|
||||||||
|
||||||||
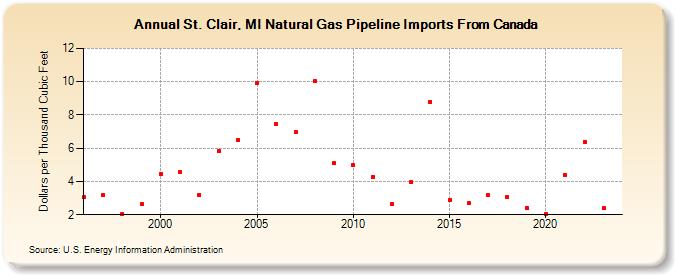
| St. Clair, MI Natural Gas Pipeline Imports From Canada (Dollars per Thousand Cubic Feet) | ||||||||
| Decade | Year-0 | Year-1 | Year-2 | Year-3 | Year-4 | Year-5 | Year-6 | Year-7 | Year-8 | Year-9 |
|---|---|---|---|---|---|---|---|---|---|---|
| 1990's | 3.04 | 3.16 | 2.07 | 2.62 | ||||||
| 2000's | 4.45 | 4.54 | 3.19 | 5.84 | 6.50 | 9.93 | 7.44 | 6.97 | 10.03 | 5.10 |
| 2010's | 4.97 | 4.29 | 2.64 | 3.96 | 8.80 | 2.91 | 2.70 | 3.17 | 3.05 | 2.41 |
| 2020's | 2.05 | 4.39 | 6.40 | 2.38 |
| - = No Data Reported; -- = Not Applicable; NA = Not Available; W = Withheld to avoid disclosure of individual company data. |
| Release Date: 4/30/2024 |
| Next Release Date: 5/31/2024 |