|
Download Data (XLS File) |
|
|||||
|
|||||
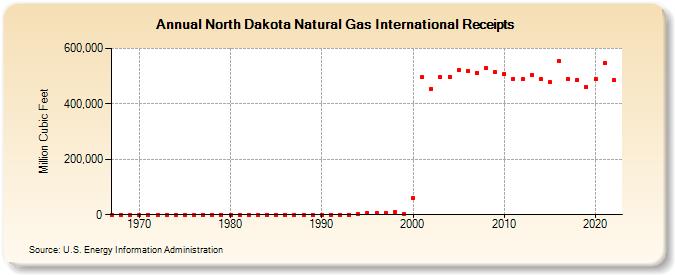
| North Dakota Natural Gas International Receipts (Million Cubic Feet) | |||||
| Decade | Year-0 | Year-1 | Year-2 | Year-3 | Year-4 | Year-5 | Year-6 | Year-7 | Year-8 | Year-9 |
|---|---|---|---|---|---|---|---|---|---|---|
| 1960's | 0 | 0 | 0 | |||||||
| 1970's | 0 | 0 | 0 | 0 | 0 | 0 | 0 | 0 | 0 | 0 |
| 1980's | 0 | 0 | 0 | 0 | 0 | 0 | 0 | 0 | 0 | 0 |
| 1990's | 0 | 0 | 0 | 0 | 1,617 | 4,559 | 6,110 | 7,672 | 9,268 | 3,416 |
| 2000's | 60,718 | 495,568 | 453,645 | 496,974 | 497,802 | 520,514 | 517,843 | 512,788 | 528,973 | 514,737 |
| 2010's | 508,781 | 491,378 | 488,366 | 505,486 | 488,455 | 477,715 | 553,971 | 489,868 | 487,073 | 460,986 |
| 2020's | 490,109 | 547,867 | 486,081 |
| - = No Data Reported; -- = Not Applicable; NA = Not Available; W = Withheld to avoid disclosure of individual company data. |
| Release Date: 3/29/2024 |
| Next Release Date: 4/30/2024 |