|
Download Data (XLS File) |
|
|||||
|
|||||
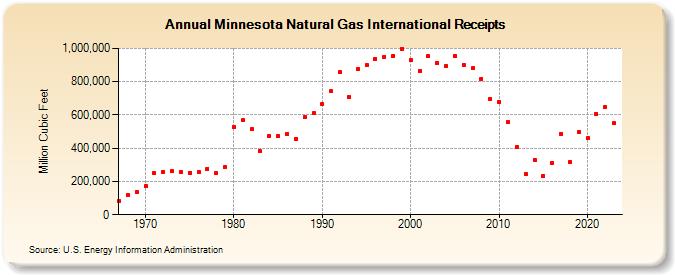
| Minnesota Natural Gas International Receipts (Million Cubic Feet) | |||||
| Decade | Year-0 | Year-1 | Year-2 | Year-3 | Year-4 | Year-5 | Year-6 | Year-7 | Year-8 | Year-9 |
|---|---|---|---|---|---|---|---|---|---|---|
| 1960's | 83,718 | 120,862 | 137,687 | |||||||
| 1970's | 172,219 | 249,935 | 256,856 | 262,434 | 256,100 | 253,638 | 254,858 | 276,453 | 248,453 | 286,290 |
| 1980's | 529,676 | 566,516 | 513,616 | 381,039 | 475,985 | 474,353 | 485,505 | 454,180 | 586,097 | 609,215 |
| 1990's | 664,982 | 741,353 | 855,300 | 707,795 | 875,226 | 899,364 | 937,806 | 950,706 | 956,733 | 998,603 |
| 2000's | 928,332 | 862,889 | 951,739 | 915,165 | 895,182 | 956,814 | 902,974 | 879,578 | 817,609 | 697,631 |
| 2010's | 680,515 | 554,738 | 406,327 | 243,805 | 330,955 | 233,011 | 312,263 | 487,541 | 316,945 | 496,527 |
| 2020's | 460,740 | 606,987 | 649,102 |
| - = No Data Reported; -- = Not Applicable; NA = Not Available; W = Withheld to avoid disclosure of individual company data. |
| Release Date: 3/29/2024 |
| Next Release Date: 4/30/2024 |