|
Download Data (XLS File) |
|
|||||
|
|||||
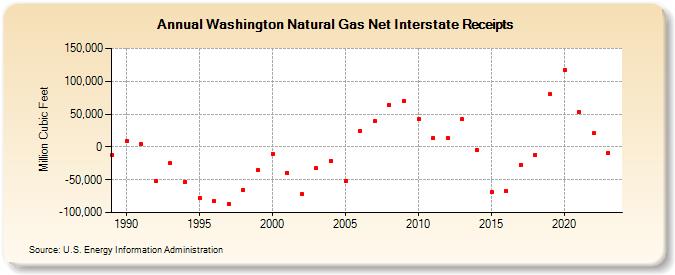
| Washington Natural Gas Net Interstate Receipts (Million Cubic Feet) | |||||
| Decade | Year-0 | Year-1 | Year-2 | Year-3 | Year-4 | Year-5 | Year-6 | Year-7 | Year-8 | Year-9 |
|---|---|---|---|---|---|---|---|---|---|---|
| 1980's | -12,539 | |||||||||
| 1990's | 8,436 | 4,807 | -51,772 | -25,073 | -52,739 | -77,764 | -82,608 | -86,505 | -65,804 | -34,869 |
| 2000's | -10,363 | -39,062 | -71,486 | -32,655 | -21,098 | -52,021 | 24,338 | 38,797 | 63,613 | 70,066 |
| 2010's | 42,437 | 13,189 | 13,905 | 41,756 | -4,766 | -68,738 | -66,765 | -26,920 | -11,783 | 79,922 |
| 2020's | 117,297 | 53,354 | 20,601 |
| - = No Data Reported; -- = Not Applicable; NA = Not Available; W = Withheld to avoid disclosure of individual company data. |
| Release Date: 4/30/2024 |
| Next Release Date: 5/31/2024 |