|
Download Data (XLS File) |
|
|||||
|
|||||
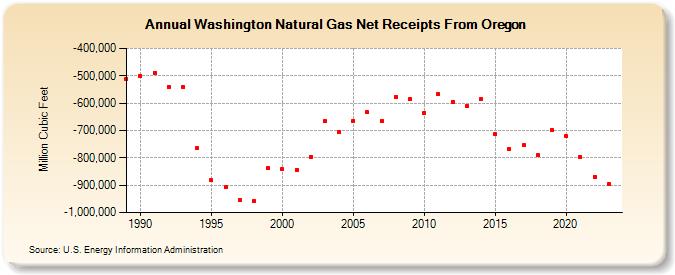
| Washington Natural Gas Net Receipts From Oregon (Million Cubic Feet) | |||||
| Decade | Year-0 | Year-1 | Year-2 | Year-3 | Year-4 | Year-5 | Year-6 | Year-7 | Year-8 | Year-9 |
|---|---|---|---|---|---|---|---|---|---|---|
| 1980's | -510,333 | |||||||||
| 1990's | -500,269 | -488,666 | -539,430 | -540,702 | -765,688 | -882,385 | -906,407 | -954,325 | -957,734 | -837,902 |
| 2000's | -841,619 | -843,213 | -796,061 | -666,614 | -705,686 | -664,318 | -634,185 | -664,269 | -576,639 | -585,117 |
| 2010's | -635,573 | -566,932 | -595,888 | -611,717 | -584,389 | -712,930 | -768,479 | -754,567 | -789,877 | -699,018 |
| 2020's | -721,957 | -796,863 | -868,621 |
| - = No Data Reported; -- = Not Applicable; NA = Not Available; W = Withheld to avoid disclosure of individual company data. |
| Release Date: 4/30/2024 |
| Next Release Date: 5/31/2024 |