|
Download Data (XLS File) |
|
|||||
|
|||||
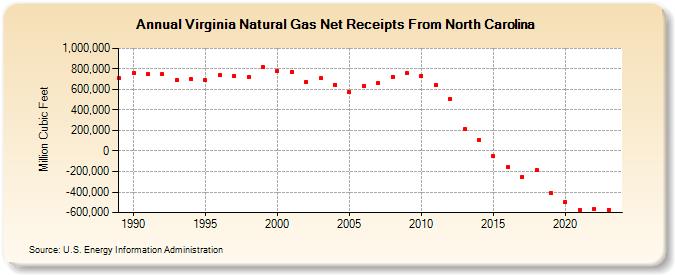
| Virginia Natural Gas Net Receipts From North Carolina (Million Cubic Feet) | |||||
| Decade | Year-0 | Year-1 | Year-2 | Year-3 | Year-4 | Year-5 | Year-6 | Year-7 | Year-8 | Year-9 |
|---|---|---|---|---|---|---|---|---|---|---|
| 1980's | 708,263 | |||||||||
| 1990's | 760,948 | 747,277 | 745,600 | 691,281 | 697,401 | 688,623 | 738,622 | 732,221 | 716,545 | 813,926 |
| 2000's | 780,309 | 772,640 | 676,704 | 706,633 | 647,796 | 576,835 | 633,746 | 664,700 | 724,122 | 756,026 |
| 2010's | 733,644 | 641,450 | 511,501 | 213,838 | 107,676 | -51,735 | -158,917 | -253,263 | -186,821 | -408,868 |
| 2020's | -495,854 | -579,065 | -564,321 |
| - = No Data Reported; -- = Not Applicable; NA = Not Available; W = Withheld to avoid disclosure of individual company data. |
| Release Date: 4/30/2024 |
| Next Release Date: 5/31/2024 |