|
Download Data (XLS File) |
|
|||||
|
|||||
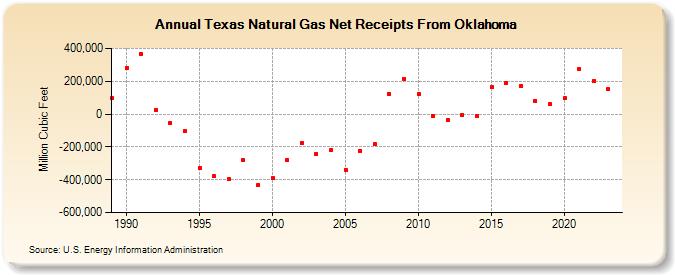
| Texas Natural Gas Net Receipts From Oklahoma (Million Cubic Feet) | |||||
| Decade | Year-0 | Year-1 | Year-2 | Year-3 | Year-4 | Year-5 | Year-6 | Year-7 | Year-8 | Year-9 |
|---|---|---|---|---|---|---|---|---|---|---|
| 1980's | 96,493 | |||||||||
| 1990's | 282,577 | 367,615 | 23,710 | -53,625 | -102,888 | -327,508 | -380,104 | -398,559 | -282,157 | -432,397 |
| 2000's | -388,953 | -278,695 | -175,274 | -240,494 | -221,521 | -338,855 | -223,013 | -183,733 | 123,642 | 215,514 |
| 2010's | 122,000 | -8,985 | -35,031 | -4,774 | -10,721 | 164,503 | 189,431 | 173,272 | 80,768 | 60,703 |
| 2020's | 96,474 | 274,002 | 204,098 |
| - = No Data Reported; -- = Not Applicable; NA = Not Available; W = Withheld to avoid disclosure of individual company data. |
| Release Date: 4/30/2024 |
| Next Release Date: 5/31/2024 |
Referring Pages: