|
Download Data (XLS File) |
|
|||||
|
|||||
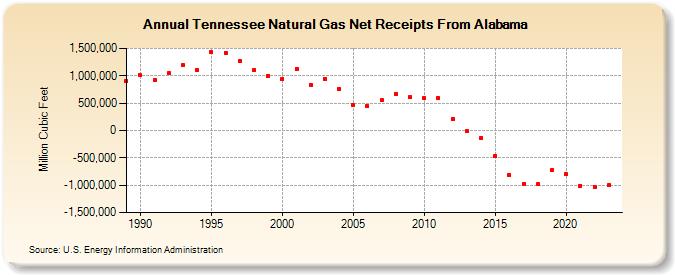
| Tennessee Natural Gas Net Receipts From Alabama (Million Cubic Feet) | |||||
| Decade | Year-0 | Year-1 | Year-2 | Year-3 | Year-4 | Year-5 | Year-6 | Year-7 | Year-8 | Year-9 |
|---|---|---|---|---|---|---|---|---|---|---|
| 1980's | 903,738 | |||||||||
| 1990's | 1,007,942 | 914,019 | 1,042,133 | 1,194,844 | 1,096,505 | 1,441,440 | 1,422,774 | 1,260,799 | 1,102,668 | 992,284 |
| 2000's | 948,538 | 1,125,998 | 839,025 | 949,625 | 763,005 | 468,474 | 442,906 | 547,857 | 670,592 | 608,445 |
| 2010's | 594,419 | 592,342 | 207,453 | -16,041 | -133,038 | -462,393 | -809,868 | -969,575 | -985,690 | -720,257 |
| 2020's | -800,071 | -1,008,028 | -1,028,310 |
| - = No Data Reported; -- = Not Applicable; NA = Not Available; W = Withheld to avoid disclosure of individual company data. |
| Release Date: 4/30/2024 |
| Next Release Date: 5/31/2024 |