|
Download Data (XLS File) |
|
|||||
|
|||||
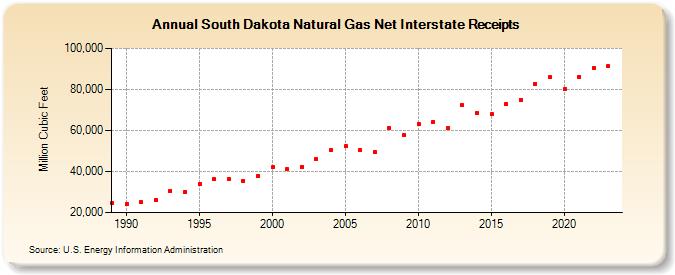
| South Dakota Natural Gas Net Interstate Receipts (Million Cubic Feet) | |||||
| Decade | Year-0 | Year-1 | Year-2 | Year-3 | Year-4 | Year-5 | Year-6 | Year-7 | Year-8 | Year-9 |
|---|---|---|---|---|---|---|---|---|---|---|
| 1980's | 24,467 | |||||||||
| 1990's | 24,092 | 24,995 | 26,225 | 30,646 | 30,255 | 33,963 | 36,327 | 36,487 | 35,390 | 37,792 |
| 2000's | 41,986 | 41,098 | 42,329 | 45,908 | 50,335 | 52,220 | 50,258 | 49,527 | 61,115 | 57,844 |
| 2010's | 63,179 | 64,154 | 61,101 | 72,325 | 68,504 | 67,810 | 72,903 | 74,985 | 82,827 | 85,832 |
| 2020's | 80,063 | 86,294 | 90,629 |
| - = No Data Reported; -- = Not Applicable; NA = Not Available; W = Withheld to avoid disclosure of individual company data. |
| Release Date: 4/30/2024 |
| Next Release Date: 5/31/2024 |