|
Download Data (XLS File) |
|
|||||
|
|||||
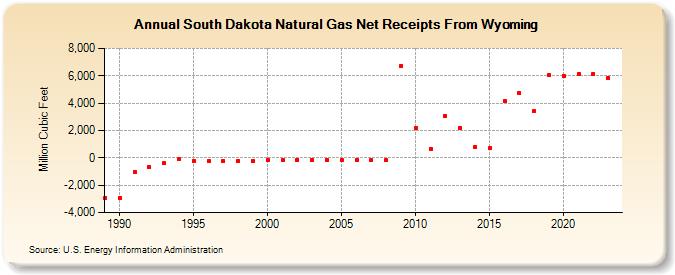
| South Dakota Natural Gas Net Receipts From Wyoming (Million Cubic Feet) | |||||
| Decade | Year-0 | Year-1 | Year-2 | Year-3 | Year-4 | Year-5 | Year-6 | Year-7 | Year-8 | Year-9 |
|---|---|---|---|---|---|---|---|---|---|---|
| 1980's | -2,926 | |||||||||
| 1990's | -2,916 | -1,027 | -665 | -410 | -85 | -199 | -220 | -241 | -231 | -232 |
| 2000's | -169 | -156 | -156 | -145 | -150 | -146 | -141 | -163 | -165 | 6,730 |
| 2010's | 2,183 | 677 | 3,079 | 2,186 | 821 | 718 | 4,149 | 4,726 | 3,419 | 6,057 |
| 2020's | 6,010 | 6,113 | 6,151 |
| - = No Data Reported; -- = Not Applicable; NA = Not Available; W = Withheld to avoid disclosure of individual company data. |
| Release Date: 4/30/2024 |
| Next Release Date: 5/31/2024 |