|
Download Data (XLS File) |
|
|||||
|
|||||
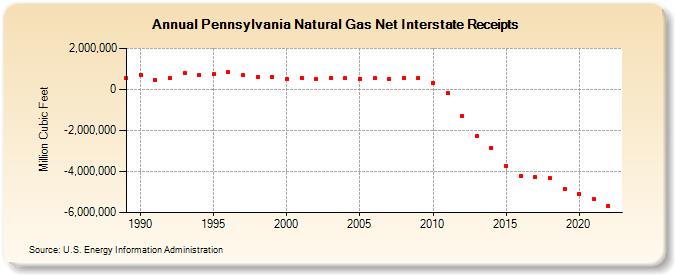
| Pennsylvania Natural Gas Net Interstate Receipts (Million Cubic Feet) | |||||
| Decade | Year-0 | Year-1 | Year-2 | Year-3 | Year-4 | Year-5 | Year-6 | Year-7 | Year-8 | Year-9 |
|---|---|---|---|---|---|---|---|---|---|---|
| 1980's | 555,248 | |||||||||
| 1990's | 706,609 | 441,647 | 579,240 | 796,695 | 688,918 | 735,243 | 845,998 | 688,887 | 612,248 | 618,461 |
| 2000's | 516,220 | 577,806 | 497,638 | 579,014 | 535,824 | 519,519 | 534,357 | 521,744 | 571,584 | 566,794 |
| 2010's | 296,250 | -190,427 | -1,281,817 | -2,284,352 | -2,851,908 | -3,710,072 | -4,238,494 | -4,283,928 | -4,335,747 | -4,843,777 |
| 2020's | -5,079,651 | -5,358,361 | -5,662,922 |
| - = No Data Reported; -- = Not Applicable; NA = Not Available; W = Withheld to avoid disclosure of individual company data. |
| Release Date: 3/29/2024 |
| Next Release Date: 4/30/2024 |