|
Download Data (XLS File) |
|
|||||
|
|||||
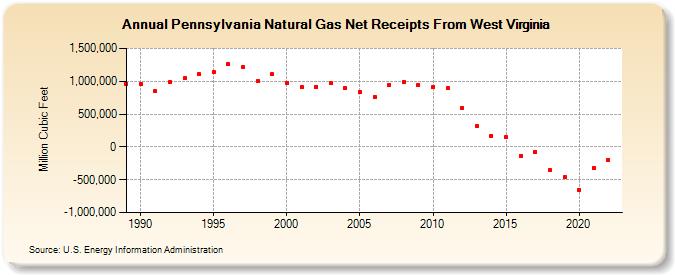
| Pennsylvania Natural Gas Net Receipts From West Virginia (Million Cubic Feet) | |||||
| Decade | Year-0 | Year-1 | Year-2 | Year-3 | Year-4 | Year-5 | Year-6 | Year-7 | Year-8 | Year-9 |
|---|---|---|---|---|---|---|---|---|---|---|
| 1980's | 960,406 | |||||||||
| 1990's | 965,316 | 850,196 | 986,780 | 1,046,191 | 1,103,848 | 1,136,769 | 1,254,932 | 1,220,825 | 1,002,488 | 1,103,826 |
| 2000's | 980,360 | 904,456 | 915,843 | 967,540 | 896,028 | 834,292 | 760,159 | 941,749 | 986,500 | 944,210 |
| 2010's | 906,277 | 892,942 | 593,899 | 312,107 | 171,244 | 150,356 | -136,377 | -73,461 | -353,471 | -463,151 |
| 2020's | -650,001 | -314,822 | -198,831 |
| - = No Data Reported; -- = Not Applicable; NA = Not Available; W = Withheld to avoid disclosure of individual company data. |
| Release Date: 3/29/2024 |
| Next Release Date: 4/30/2024 |