|
Download Data (XLS File) |
|
|||||
|
|||||
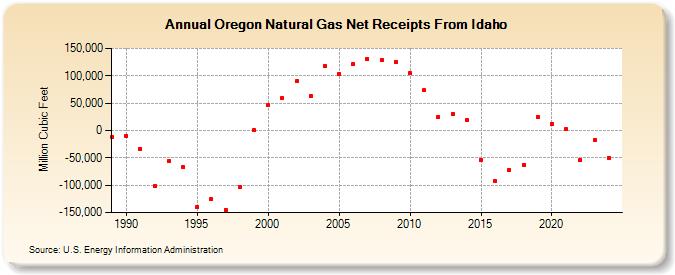
| Oregon Natural Gas Net Receipts From Idaho (Million Cubic Feet) | |||||
| Decade | Year-0 | Year-1 | Year-2 | Year-3 | Year-4 | Year-5 | Year-6 | Year-7 | Year-8 | Year-9 |
|---|---|---|---|---|---|---|---|---|---|---|
| 1980's | -11,868 | |||||||||
| 1990's | -9,309 | -33,302 | -101,735 | -55,738 | -66,942 | -139,367 | -126,012 | -144,868 | -103,240 | 685 |
| 2000's | 45,837 | 58,769 | 89,938 | 63,133 | 116,995 | 103,624 | 121,049 | 130,420 | 128,885 | 125,492 |
| 2010's | 104,900 | 73,448 | 24,613 | 30,688 | 19,519 | -53,135 | -93,141 | -71,621 | -62,244 | 24,906 |
| 2020's | 12,285 | 1,892 | -54,250 |
| - = No Data Reported; -- = Not Applicable; NA = Not Available; W = Withheld to avoid disclosure of individual company data. |
| Release Date: 4/30/2024 |
| Next Release Date: 5/31/2024 |