|
Download Data (XLS File) |
|
|||||
|
|||||
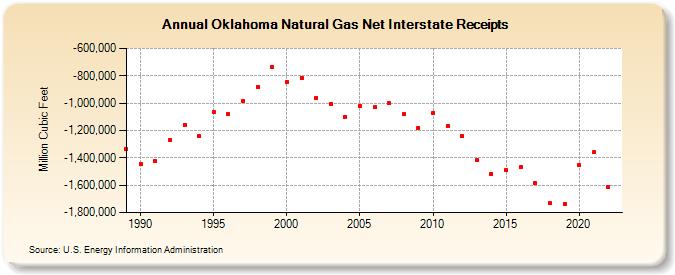
| Oklahoma Natural Gas Net Interstate Receipts (Million Cubic Feet) | |||||
| Decade | Year-0 | Year-1 | Year-2 | Year-3 | Year-4 | Year-5 | Year-6 | Year-7 | Year-8 | Year-9 |
|---|---|---|---|---|---|---|---|---|---|---|
| 1980's | -1,335,130 | |||||||||
| 1990's | -1,444,386 | -1,426,181 | -1,266,516 | -1,159,222 | -1,242,085 | -1,062,232 | -1,080,240 | -988,152 | -881,316 | -739,067 |
| 2000's | -845,206 | -814,359 | -960,370 | -1,002,889 | -1,102,049 | -1,017,835 | -1,029,015 | -1,001,334 | -1,081,980 | -1,181,875 |
| 2010's | -1,071,115 | -1,164,898 | -1,237,167 | -1,418,183 | -1,515,891 | -1,491,941 | -1,466,993 | -1,586,458 | -1,733,495 | -1,735,668 |
| 2020's | -1,451,178 | -1,359,778 | -1,613,850 |
| - = No Data Reported; -- = Not Applicable; NA = Not Available; W = Withheld to avoid disclosure of individual company data. |
| Release Date: 4/30/2024 |
| Next Release Date: 5/31/2024 |