|
Download Data (XLS File) |
|
|||||
|
|||||
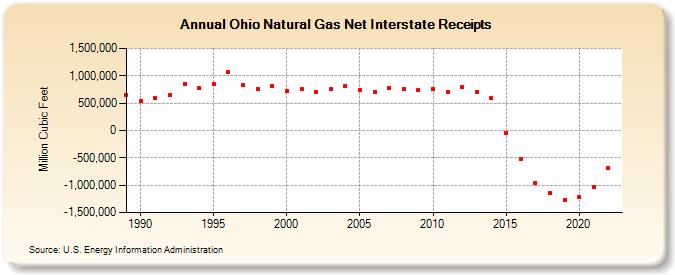
| Ohio Natural Gas Net Interstate Receipts (Million Cubic Feet) | |||||
| Decade | Year-0 | Year-1 | Year-2 | Year-3 | Year-4 | Year-5 | Year-6 | Year-7 | Year-8 | Year-9 |
|---|---|---|---|---|---|---|---|---|---|---|
| 1980's | 647,600 | |||||||||
| 1990's | 532,579 | 593,599 | 643,869 | 856,415 | 779,245 | 842,107 | 1,067,640 | 826,767 | 766,728 | 819,664 |
| 2000's | 728,282 | 759,745 | 699,643 | 758,606 | 812,749 | 743,030 | 706,143 | 769,166 | 755,268 | 731,084 |
| 2010's | 764,263 | 710,322 | 801,419 | 709,958 | 590,099 | -48,385 | -527,089 | -951,403 | -1,142,112 | -1,271,705 |
| 2020's | -1,215,942 | -1,041,050 | -691,351 |
| - = No Data Reported; -- = Not Applicable; NA = Not Available; W = Withheld to avoid disclosure of individual company data. |
| Release Date: 4/30/2024 |
| Next Release Date: 5/31/2024 |
Referring Pages: