|
Download Data (XLS File) |
|
|||||
|
|||||
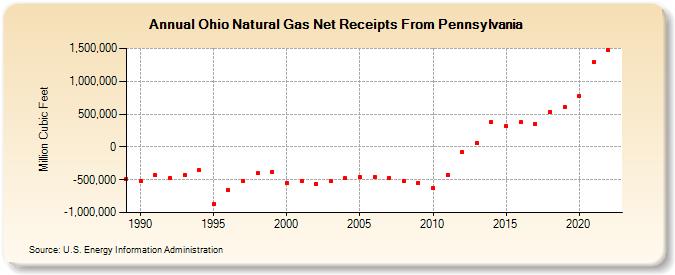
| Ohio Natural Gas Net Receipts From Pennsylvania (Million Cubic Feet) | |||||
| Decade | Year-0 | Year-1 | Year-2 | Year-3 | Year-4 | Year-5 | Year-6 | Year-7 | Year-8 | Year-9 |
|---|---|---|---|---|---|---|---|---|---|---|
| 1980's | -493,766 | |||||||||
| 1990's | -526,545 | -432,993 | -481,327 | -426,042 | -358,334 | -870,658 | -656,306 | -515,062 | -401,464 | -380,077 |
| 2000's | -554,072 | -516,828 | -560,176 | -525,828 | -474,329 | -459,459 | -452,612 | -471,965 | -518,998 | -550,776 |
| 2010's | -629,125 | -421,483 | -77,169 | 58,129 | 382,091 | 313,399 | 374,992 | 349,083 | 535,556 | 608,211 |
| 2020's | 777,948 | 1,295,472 | 1,473,371 |
| - = No Data Reported; -- = Not Applicable; NA = Not Available; W = Withheld to avoid disclosure of individual company data. |
| Release Date: 4/30/2024 |
| Next Release Date: 5/31/2024 |
Referring Pages: