|
Download Data (XLS File) |
|
|||||
|
|||||
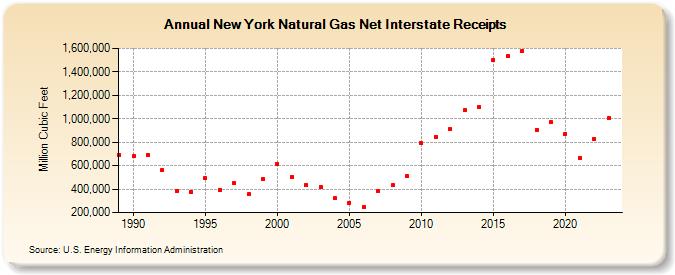
| New York Natural Gas Net Interstate Receipts (Million Cubic Feet) | |||||
| Decade | Year-0 | Year-1 | Year-2 | Year-3 | Year-4 | Year-5 | Year-6 | Year-7 | Year-8 | Year-9 |
|---|---|---|---|---|---|---|---|---|---|---|
| 1980's | 690,969 | |||||||||
| 1990's | 678,905 | 691,123 | 561,333 | 386,236 | 376,865 | 490,624 | 396,182 | 450,079 | 355,404 | 483,771 |
| 2000's | 616,190 | 507,019 | 433,154 | 419,757 | 321,183 | 284,875 | 248,061 | 383,951 | 431,850 | 511,320 |
| 2010's | 790,049 | 848,262 | 913,482 | 1,072,955 | 1,098,252 | 1,500,212 | 1,534,984 | 1,578,096 | 906,292 | 968,173 |
| 2020's | 873,030 | 666,444 | 830,154 |
| - = No Data Reported; -- = Not Applicable; NA = Not Available; W = Withheld to avoid disclosure of individual company data. |
| Release Date: 4/30/2024 |
| Next Release Date: 5/31/2024 |