|
Download Data (XLS File) |
|
|||||
|
|||||
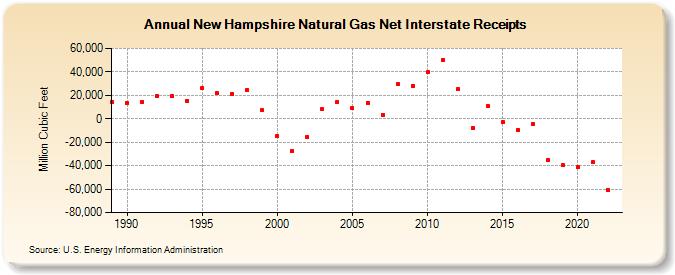
| New Hampshire Natural Gas Net Interstate Receipts (Million Cubic Feet) | |||||
| Decade | Year-0 | Year-1 | Year-2 | Year-3 | Year-4 | Year-5 | Year-6 | Year-7 | Year-8 | Year-9 |
|---|---|---|---|---|---|---|---|---|---|---|
| 1980's | 14,079 | |||||||||
| 1990's | 13,634 | 14,680 | 18,975 | 19,270 | 15,365 | 26,221 | 21,548 | 21,287 | 24,365 | 7,227 |
| 2000's | -14,574 | -27,335 | -15,505 | 7,927 | 14,216 | 8,895 | 13,597 | 3,508 | 29,398 | 27,768 |
| 2010's | 39,443 | 50,354 | 25,020 | -7,591 | 10,915 | -2,907 | -9,499 | -4,424 | -35,423 | -39,846 |
| 2020's | -41,518 | -37,232 | -60,968 |
| - = No Data Reported; -- = Not Applicable; NA = Not Available; W = Withheld to avoid disclosure of individual company data. |
| Release Date: 4/30/2024 |
| Next Release Date: 5/31/2024 |