|
Download Data (XLS File) |
|
|||||
|
|||||
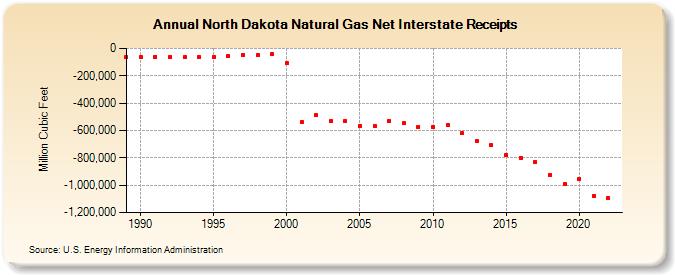
| North Dakota Natural Gas Net Interstate Receipts (Million Cubic Feet) | |||||
| Decade | Year-0 | Year-1 | Year-2 | Year-3 | Year-4 | Year-5 | Year-6 | Year-7 | Year-8 | Year-9 |
|---|---|---|---|---|---|---|---|---|---|---|
| 1980's | -64,474 | |||||||||
| 1990's | -64,687 | -59,695 | -62,738 | -63,545 | -63,586 | -61,585 | -55,646 | -46,569 | -48,759 | -43,203 |
| 2000's | -109,382 | -536,471 | -487,883 | -533,853 | -531,412 | -564,758 | -568,519 | -530,734 | -548,781 | -571,893 |
| 2010's | -572,275 | -559,274 | -619,383 | -677,998 | -707,038 | -776,001 | -800,889 | -829,109 | -922,414 | -994,812 |
| 2020's | -953,462 | -1,076,670 | -1,094,995 |
| - = No Data Reported; -- = Not Applicable; NA = Not Available; W = Withheld to avoid disclosure of individual company data. |
| Release Date: 4/30/2024 |
| Next Release Date: 5/31/2024 |