|
Download Data (XLS File) |
|
|||||
|
|||||
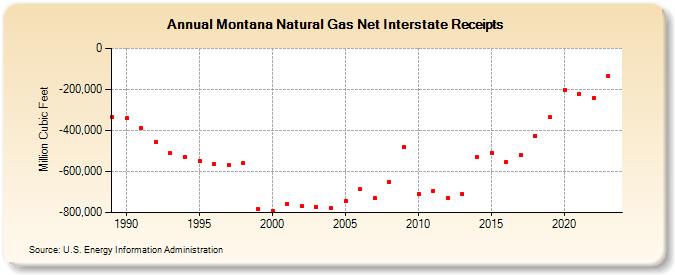
| Montana Natural Gas Net Interstate Receipts (Million Cubic Feet) | |||||
| Decade | Year-0 | Year-1 | Year-2 | Year-3 | Year-4 | Year-5 | Year-6 | Year-7 | Year-8 | Year-9 |
|---|---|---|---|---|---|---|---|---|---|---|
| 1980's | -335,869 | |||||||||
| 1990's | -339,694 | -386,379 | -457,024 | -510,908 | -531,252 | -549,645 | -563,027 | -568,869 | -556,233 | -782,506 |
| 2000's | -792,097 | -755,898 | -766,804 | -773,586 | -779,657 | -745,586 | -685,388 | -730,328 | -652,420 | -479,894 |
| 2010's | -708,748 | -692,647 | -730,755 | -709,513 | -530,668 | -508,996 | -554,322 | -521,533 | -424,730 | -336,233 |
| 2020's | -202,534 | -219,980 | -239,405 |
| - = No Data Reported; -- = Not Applicable; NA = Not Available; W = Withheld to avoid disclosure of individual company data. |
| Release Date: 3/29/2024 |
| Next Release Date: 4/30/2024 |