|
Download Data (XLS File) |
|
|||||
|
|||||
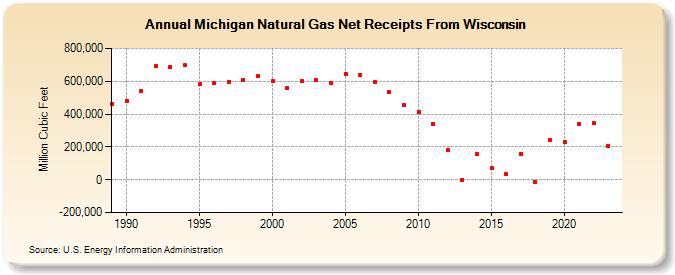
| Michigan Natural Gas Net Receipts From Wisconsin (Million Cubic Feet) | |||||
| Decade | Year-0 | Year-1 | Year-2 | Year-3 | Year-4 | Year-5 | Year-6 | Year-7 | Year-8 | Year-9 |
|---|---|---|---|---|---|---|---|---|---|---|
| 1980's | 464,124 | |||||||||
| 1990's | 481,849 | 542,841 | 692,709 | 686,816 | 695,986 | 581,264 | 590,493 | 597,910 | 610,267 | 629,551 |
| 2000's | 601,033 | 556,701 | 601,560 | 605,723 | 591,831 | 644,095 | 640,462 | 593,469 | 537,202 | 453,608 |
| 2010's | 415,217 | 342,424 | 180,507 | 954 | 153,872 | 70,984 | 32,191 | 156,999 | -13,137 | 244,529 |
| 2020's | 228,360 | 342,487 | 343,584 |
| - = No Data Reported; -- = Not Applicable; NA = Not Available; W = Withheld to avoid disclosure of individual company data. |
| Release Date: 4/30/2024 |
| Next Release Date: 5/31/2024 |