|
Download Data (XLS File) |
|
|||||
|
|||||
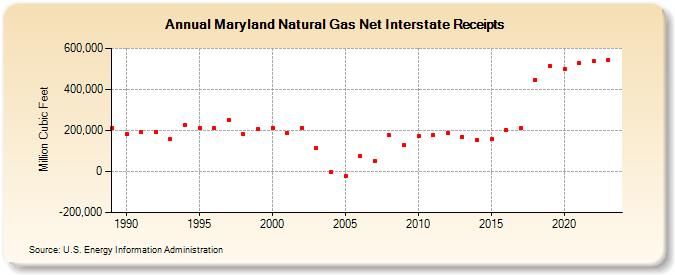
| Maryland Natural Gas Net Interstate Receipts (Million Cubic Feet) | |||||
| Decade | Year-0 | Year-1 | Year-2 | Year-3 | Year-4 | Year-5 | Year-6 | Year-7 | Year-8 | Year-9 |
|---|---|---|---|---|---|---|---|---|---|---|
| 1980's | 211,424 | |||||||||
| 1990's | 181,796 | 192,200 | 192,423 | 157,062 | 226,594 | 212,069 | 210,215 | 251,756 | 180,453 | 207,457 |
| 2000's | 214,110 | 187,592 | 213,692 | 114,131 | -3,194 | -21,658 | 73,328 | 52,700 | 176,714 | 128,286 |
| 2010's | 174,153 | 177,528 | 188,431 | 170,255 | 153,799 | 156,274 | 203,210 | 213,019 | 447,447 | 516,012 |
| 2020's | 500,158 | 528,781 | 536,821 |
| - = No Data Reported; -- = Not Applicable; NA = Not Available; W = Withheld to avoid disclosure of individual company data. |
| Release Date: 3/29/2024 |
| Next Release Date: 4/30/2024 |