|
Download Data (XLS File) |
|
|||||
|
|||||
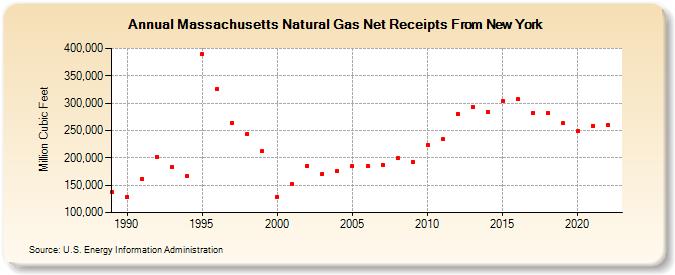
| Massachusetts Natural Gas Net Receipts From New York (Million Cubic Feet) | |||||
| Decade | Year-0 | Year-1 | Year-2 | Year-3 | Year-4 | Year-5 | Year-6 | Year-7 | Year-8 | Year-9 |
|---|---|---|---|---|---|---|---|---|---|---|
| 1980's | 136,730 | |||||||||
| 1990's | 128,941 | 161,827 | 202,331 | 182,891 | 166,394 | 389,828 | 326,187 | 264,309 | 244,052 | 211,593 |
| 2000's | 129,052 | 151,736 | 185,849 | 171,269 | 176,485 | 185,150 | 184,690 | 187,479 | 199,028 | 192,558 |
| 2010's | 223,017 | 234,276 | 280,584 | 293,259 | 283,910 | 303,279 | 306,932 | 282,748 | 282,530 | 262,891 |
| 2020's | 248,920 | 258,851 | 260,400 |
| - = No Data Reported; -- = Not Applicable; NA = Not Available; W = Withheld to avoid disclosure of individual company data. |
| Release Date: 4/30/2024 |
| Next Release Date: 5/31/2024 |