|
Download Data (XLS File) |
|
|||||
|
|||||
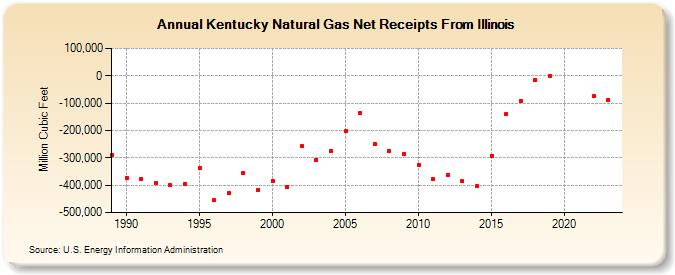
| Kentucky Natural Gas Net Receipts From Illinois (Million Cubic Feet) | |||||
| Decade | Year-0 | Year-1 | Year-2 | Year-3 | Year-4 | Year-5 | Year-6 | Year-7 | Year-8 | Year-9 |
|---|---|---|---|---|---|---|---|---|---|---|
| 1980's | -287,892 | |||||||||
| 1990's | -372,384 | -375,924 | -390,368 | -400,227 | -397,138 | -335,428 | -454,131 | -430,037 | -355,850 | -416,682 |
| 2000's | -383,316 | -405,019 | -256,562 | -306,980 | -274,595 | -202,996 | -136,584 | -250,391 | -275,796 | -287,772 |
| 2010's | -326,938 | -376,707 | -361,707 | -386,440 | -404,626 | -291,486 | -140,640 | -90,859 | -15,037 | 0 |
| 2020's | -74,928 |
| - = No Data Reported; -- = Not Applicable; NA = Not Available; W = Withheld to avoid disclosure of individual company data. |
| Release Date: 4/30/2024 |
| Next Release Date: 5/31/2024 |