|
Download Data (XLS File) |
|
|||||
|
|||||
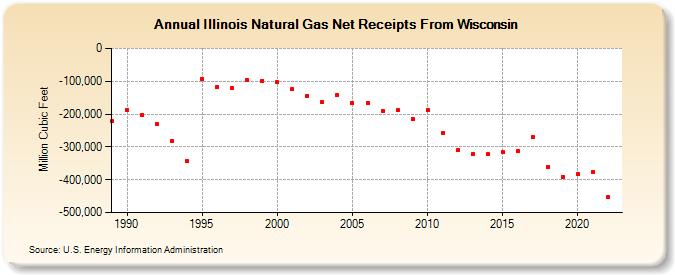
| Illinois Natural Gas Net Receipts From Wisconsin (Million Cubic Feet) | |||||
| Decade | Year-0 | Year-1 | Year-2 | Year-3 | Year-4 | Year-5 | Year-6 | Year-7 | Year-8 | Year-9 |
|---|---|---|---|---|---|---|---|---|---|---|
| 1980's | -221,441 | |||||||||
| 1990's | -186,885 | -201,667 | -231,690 | -282,022 | -344,379 | -92,918 | -118,256 | -119,973 | -96,709 | -98,423 |
| 2000's | -103,335 | -125,126 | -143,945 | -163,439 | -143,293 | -165,505 | -166,666 | -189,680 | -189,060 | -214,311 |
| 2010's | -187,742 | -257,176 | -309,900 | -322,003 | -321,730 | -316,850 | -312,593 | -270,707 | -360,468 | -390,415 |
| 2020's | -383,114 | -376,489 | -453,477 |
| - = No Data Reported; -- = Not Applicable; NA = Not Available; W = Withheld to avoid disclosure of individual company data. |
| Release Date: 3/29/2024 |
| Next Release Date: 4/30/2024 |