|
Download Data (XLS File) |
|
|||||
|
|||||
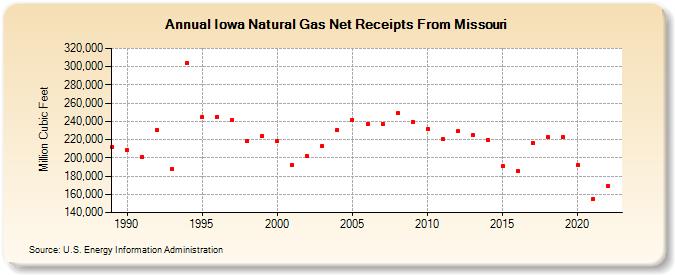
| Iowa Natural Gas Net Receipts From Missouri (Million Cubic Feet) | |||||
| Decade | Year-0 | Year-1 | Year-2 | Year-3 | Year-4 | Year-5 | Year-6 | Year-7 | Year-8 | Year-9 |
|---|---|---|---|---|---|---|---|---|---|---|
| 1980's | 211,798 | |||||||||
| 1990's | 208,525 | 201,185 | 230,275 | 188,156 | 304,069 | 244,486 | 245,148 | 241,023 | 218,644 | 224,184 |
| 2000's | 218,730 | 192,397 | 201,467 | 212,812 | 230,381 | 241,843 | 236,600 | 237,574 | 248,647 | 239,493 |
| 2010's | 231,448 | 220,830 | 229,050 | 224,910 | 219,744 | 190,954 | 185,602 | 216,058 | 222,493 | 222,562 |
| 2020's | 192,215 | 154,470 | 169,304 |
| - = No Data Reported; -- = Not Applicable; NA = Not Available; W = Withheld to avoid disclosure of individual company data. |
| Release Date: 4/30/2024 |
| Next Release Date: 5/31/2024 |
Referring Pages: