|
Download Data (XLS File) |
|
|||||
|
|||||
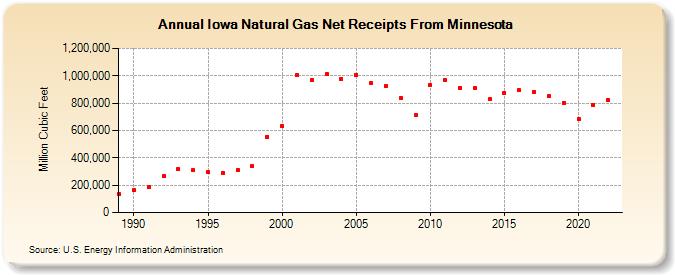
| Iowa Natural Gas Net Receipts From Minnesota (Million Cubic Feet) | |||||
| Decade | Year-0 | Year-1 | Year-2 | Year-3 | Year-4 | Year-5 | Year-6 | Year-7 | Year-8 | Year-9 |
|---|---|---|---|---|---|---|---|---|---|---|
| 1980's | 134,382 | |||||||||
| 1990's | 162,185 | 186,752 | 266,590 | 316,180 | 308,214 | 294,377 | 292,711 | 309,464 | 337,636 | 553,440 |
| 2000's | 633,593 | 1,004,921 | 971,985 | 1,011,614 | 975,008 | 1,008,540 | 949,835 | 926,703 | 837,975 | 711,227 |
| 2010's | 935,289 | 966,560 | 912,900 | 914,082 | 827,125 | 877,240 | 892,672 | 882,188 | 848,716 | 801,932 |
| 2020's | 684,668 | 786,958 | 820,562 |
| - = No Data Reported; -- = Not Applicable; NA = Not Available; W = Withheld to avoid disclosure of individual company data. |
| Release Date: 4/30/2024 |
| Next Release Date: 5/31/2024 |
Referring Pages: