|
Download Data (XLS File) |
|
|||||
|
|||||
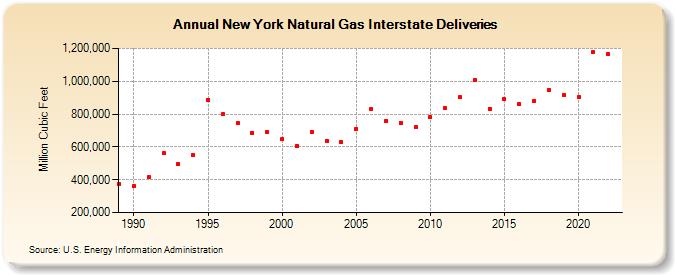
| New York Natural Gas Interstate Deliveries (Million Cubic Feet) | |||||
| Decade | Year-0 | Year-1 | Year-2 | Year-3 | Year-4 | Year-5 | Year-6 | Year-7 | Year-8 | Year-9 |
|---|---|---|---|---|---|---|---|---|---|---|
| 1980's | 375,695 | |||||||||
| 1990's | 360,693 | 414,155 | 559,844 | 495,010 | 549,862 | 886,014 | 798,572 | 746,689 | 686,882 | 690,146 |
| 2000's | 646,212 | 608,135 | 689,442 | 636,508 | 627,898 | 710,856 | 829,103 | 759,014 | 747,528 | 718,739 |
| 2010's | 779,299 | 835,150 | 902,217 | 1,006,949 | 831,103 | 889,203 | 861,276 | 878,812 | 946,746 | 916,886 |
| 2020's | 903,594 | 1,176,738 | 1,163,080 |
| - = No Data Reported; -- = Not Applicable; NA = Not Available; W = Withheld to avoid disclosure of individual company data. |
| Release Date: 3/29/2024 |
| Next Release Date: 4/30/2024 |